This text format is an edited transcript of the webinar, Breaking Down Research for the Physical Therapist Assistant, presented by Kevin Cezat, PT, DPT, GCS. It is recommended to download the course handout to supplement this text format.
Learning Outcomes
After this course, participants will be able to:
- Rank the hierarchy levels of research
- List at least five research terms and their meanings
- List at least three statistics terms and their meaning
Introduction
Before we get into our topic today, I want to provide some background on my experiences with research and statistics. This will give you insight into my perspective as we dive into interpreting research.
I completed my undergraduate degree in health sciences at Wayne State University in Detroit. I had some basic exposure to statistics through required courses, but minimal experience with research beyond reading studies related to my classes. It wasn't until graduate school at the University of Central Florida (UCF) that I truly had to grapple with research terminology, statistical analysis, and reading extensive academic literature. Even then, I didn't fully appreciate the importance and value of understanding research.
One memorable moment from physical therapy school highlights this. In our first semester, we had to present journal articles related to our coursework. Being a procrastinator, I hastily searched the database the morning I was to present and selected an article from a respectable journal based on its recent publication date. The topic was the effects of heat prior to external analgesic use and the effect on pain control. Perfect, I thought, as we were studying pain.
I breezed through my synopsis of the article's methods, findings, etc. Then during Q&A, someone asked about the sample size. I had neglected that detail - it was a sample size of one. As it turned out, this "study" amounted to a researcher taking a bath before applying topical pain relief cream and subjectively rating the results. As I explained this dubious methodology, my classmates snickered at the weak evidence I had presented.
From that embarrassment onward, I committed to truly understanding research and using it appropriately as a physical therapist. Through the program, we focused on deconstructing studies and grasping statistical analysis tools to interpret them accurately. While I'm no expert statistician, I developed competence in evaluating research rigor and meaning.
UCF had just transitioned to offering a doctoral program when I attended, so research was a bigger component of the degree. We had to conduct original research, though it was still fairly basic in the infancy stage of the program. But it gave me an eye-opening experience into the intensive work involved - I had to read a stack of articles several feet high just to formulate a research plan! The data collection and IRB approval process for experimental studies were intense also.
I graduated feeling supercharged about research and its role in informing physical therapy best practices. However, my first job in a skilled nursing facility was not receptive to evidence-based practice changes. Over 12 years across settings from staff to management, I've tried to move the needle on quality and outcomes in post-acute care. Now as a director overseeing clinical programming nationally, it's my full-time mission.
Research and Statistics
We'll start with a basic review of terminology. Research is generally described as collecting and analyzing information to increase our understanding of a topic. It usually consists of three parts - posing a question, collecting data, and then presenting an answer. Statistics is complementary to research but different. Statistics is a mathematical science focused on studying and manipulating data. That manipulation term will come up a lot because it has a negative connotation. But to understand information, we do need to manipulate it. This involves gathering, reviewing, analyzing, and drawing conclusions from datasets. Research and statistics are powerful tools for conveying information and impacting people's choices and thinking. Many opinions today are formed based on research and statistics.
The challenge is they're often misused or misunderstood. By misunderstood, I mean inappropriate application, which can happen without malintent. Statistics and research are complicated and easy to misinterpret. They can also be misused to mislead people for ulterior motives by skewing the data. You may have heard the expression "statistics don't lie, but liars use statistics" because they're easy yet powerful tools for pushing lies if that's the intent.
We need a basic understanding of these tools and how to evaluate them skeptically. This is an introductory course focused on the basics. It will start you on the path to breaking down research and data well, but won't make you an expert. Still, it can start to move you toward becoming adept at understanding these topics.
Use Of Research Within Physical Therapy Practice
The profession of physical therapy has evolved over time, similar to other healthcare professions. Many professions started out practicing according to anecdotal findings, as initially there wasn't a lot of research supporting the effectiveness of various interventions. Physical Therapy is becoming an evidence-based practice more and more. We're using research to guide clinical decision-making and treatments much more year over year, driven by a growing body of research. There's research being performed continuously on the effectiveness of interventions and also the ineffectiveness of interventions we perform. There is also an increased focus on patient-centered care and how we adapt to that, as well as research on the importance of improving outcomes. Evidence-based practice is also a focus of our professional association, the American Physical Therapy Association (APTA).
APTA Impact on Research
The APTA directly funds research related to physical therapy topics and provides access to large databases for its members. A key challenge is that APTA membership is voluntary, which has pros and cons. Members are likely committed to the APTA's mission and values, and those professionals are pushing the profession forward. However, voluntary membership limits the APTA's power, outreach, funds, and ability to standardize and evolve the industry. Looking at workforce data and numbers from APTA, we know that a minority of physical therapy professionals (physical therapists and physical therapist assistants) belong to our professional organization.
Why Should We Care About Research?
One question is - why should we care about research? Why does research matter if we're already doing a good job and patients are getting better?
Unfortunately, some unfavorable studies highlight significant problems. One large study by Zadro and colleagues in 2019 found PT treatment choices for musculoskeletal conditions were often not evidence-based, but rather relied on clinical expertise or were hard to justify. This variability and lack of clear reasoning put our profession at risk if treatments are not supported or we are not open to change based on evidence. It is also a disservice to patients.
Interestingly, treatment was not evidence-based despite over 40,000 available resources like clinical guidelines, systematic reviews, and trials. Some top sources should specifically guide practice, yet we lack consensus. Who is responsible - APTA, schools, or individual clinicians? Certainly, APTA and PT schools have a responsibility, but the onus is on us. We must continually evaluate our practice, remain open to change, and follow the evidence.
Consider a visit to an oncologist for cancer treatment - you'd expect options with pros/cons and a gold standard recommendation based on evidence, but not 10 completely different treatments. But that can be the perception of our PT patients; they may experience a lack of discussion of options, evidence, and goals. We shouldn't accept variability physicians wouldn't. We must be evidence-based, using the best available evidence along with expertise and patient preferences.
This is key as healthcare moves to an outcome value-based model requiring efficiency - we must do more with less and get people better faster. Research helps determine the most effective and efficient interventions to survive in this model. Advancing the profession also requires identifying new, promising treatments through research on things like telehealth, VR, blood flow restriction, biofeedback, etc. Research builds critical thinking skills applicable to practice, and helps you grow as a clinician. Evidence from research is also invaluable in advocating for and strengthening our profession.
Role of Research for the Physical Therapist Assistant
Most PTA programs include some training on research methods, evidence-based practice, and statistics. They also cover evaluating studies and applying findings clinically. However, your exposure to research varies widely depending on when you graduated. And like other skills, these skills can be lost without actively reading or participating in research.
PTA involvement in active research is limited - it's not typically part of PTA programs or required for licensure. Without early exposure, pursuing research later on in your career is more intimidating. Still, research and evidence should guide PTA clinical decisions, just as with PTs. Many studies address interventions well within the PTA scope. We have good research to guide your practice such as clinical practice guidelines on things like dosing and progressing methodologies. Also, recommendations for de-implementation of interventions when new research emerges.
The APTA and Federation of State Boards of Physical Therapy have made recommendations for changes in PTA education and the need for PTAs to become consumers of research. Reasons include more remote supervision or limited supervision, complex patients, and the move toward efficiency and outcome-based models. These industry trends are clear in settings like SNFs, outpatient clinics, and home health.
The key is embracing change and the opportunities it brings. Research is the tool to accomplish this. Rather than fearing change, we should try to adapt to help achieve goals like shorter stays and more efficient outcomes for our patients. Research helps PTAs play a role in advancing the profession.
Types and Levels of Research
There are multiple ways to rank the quality and strength of research. There are different hierarchies and guidance on how to apply them, but there are also disagreements on the exact ranking of evidence hierarchies.
The Levels of Evidence hierarchy pyramid is most commonly used in health fields. It is promoted by the National Health and Medical Research Council regarding evidence-based practice specifically. For our purposes today, it is the one we'll cover (Figure 1).
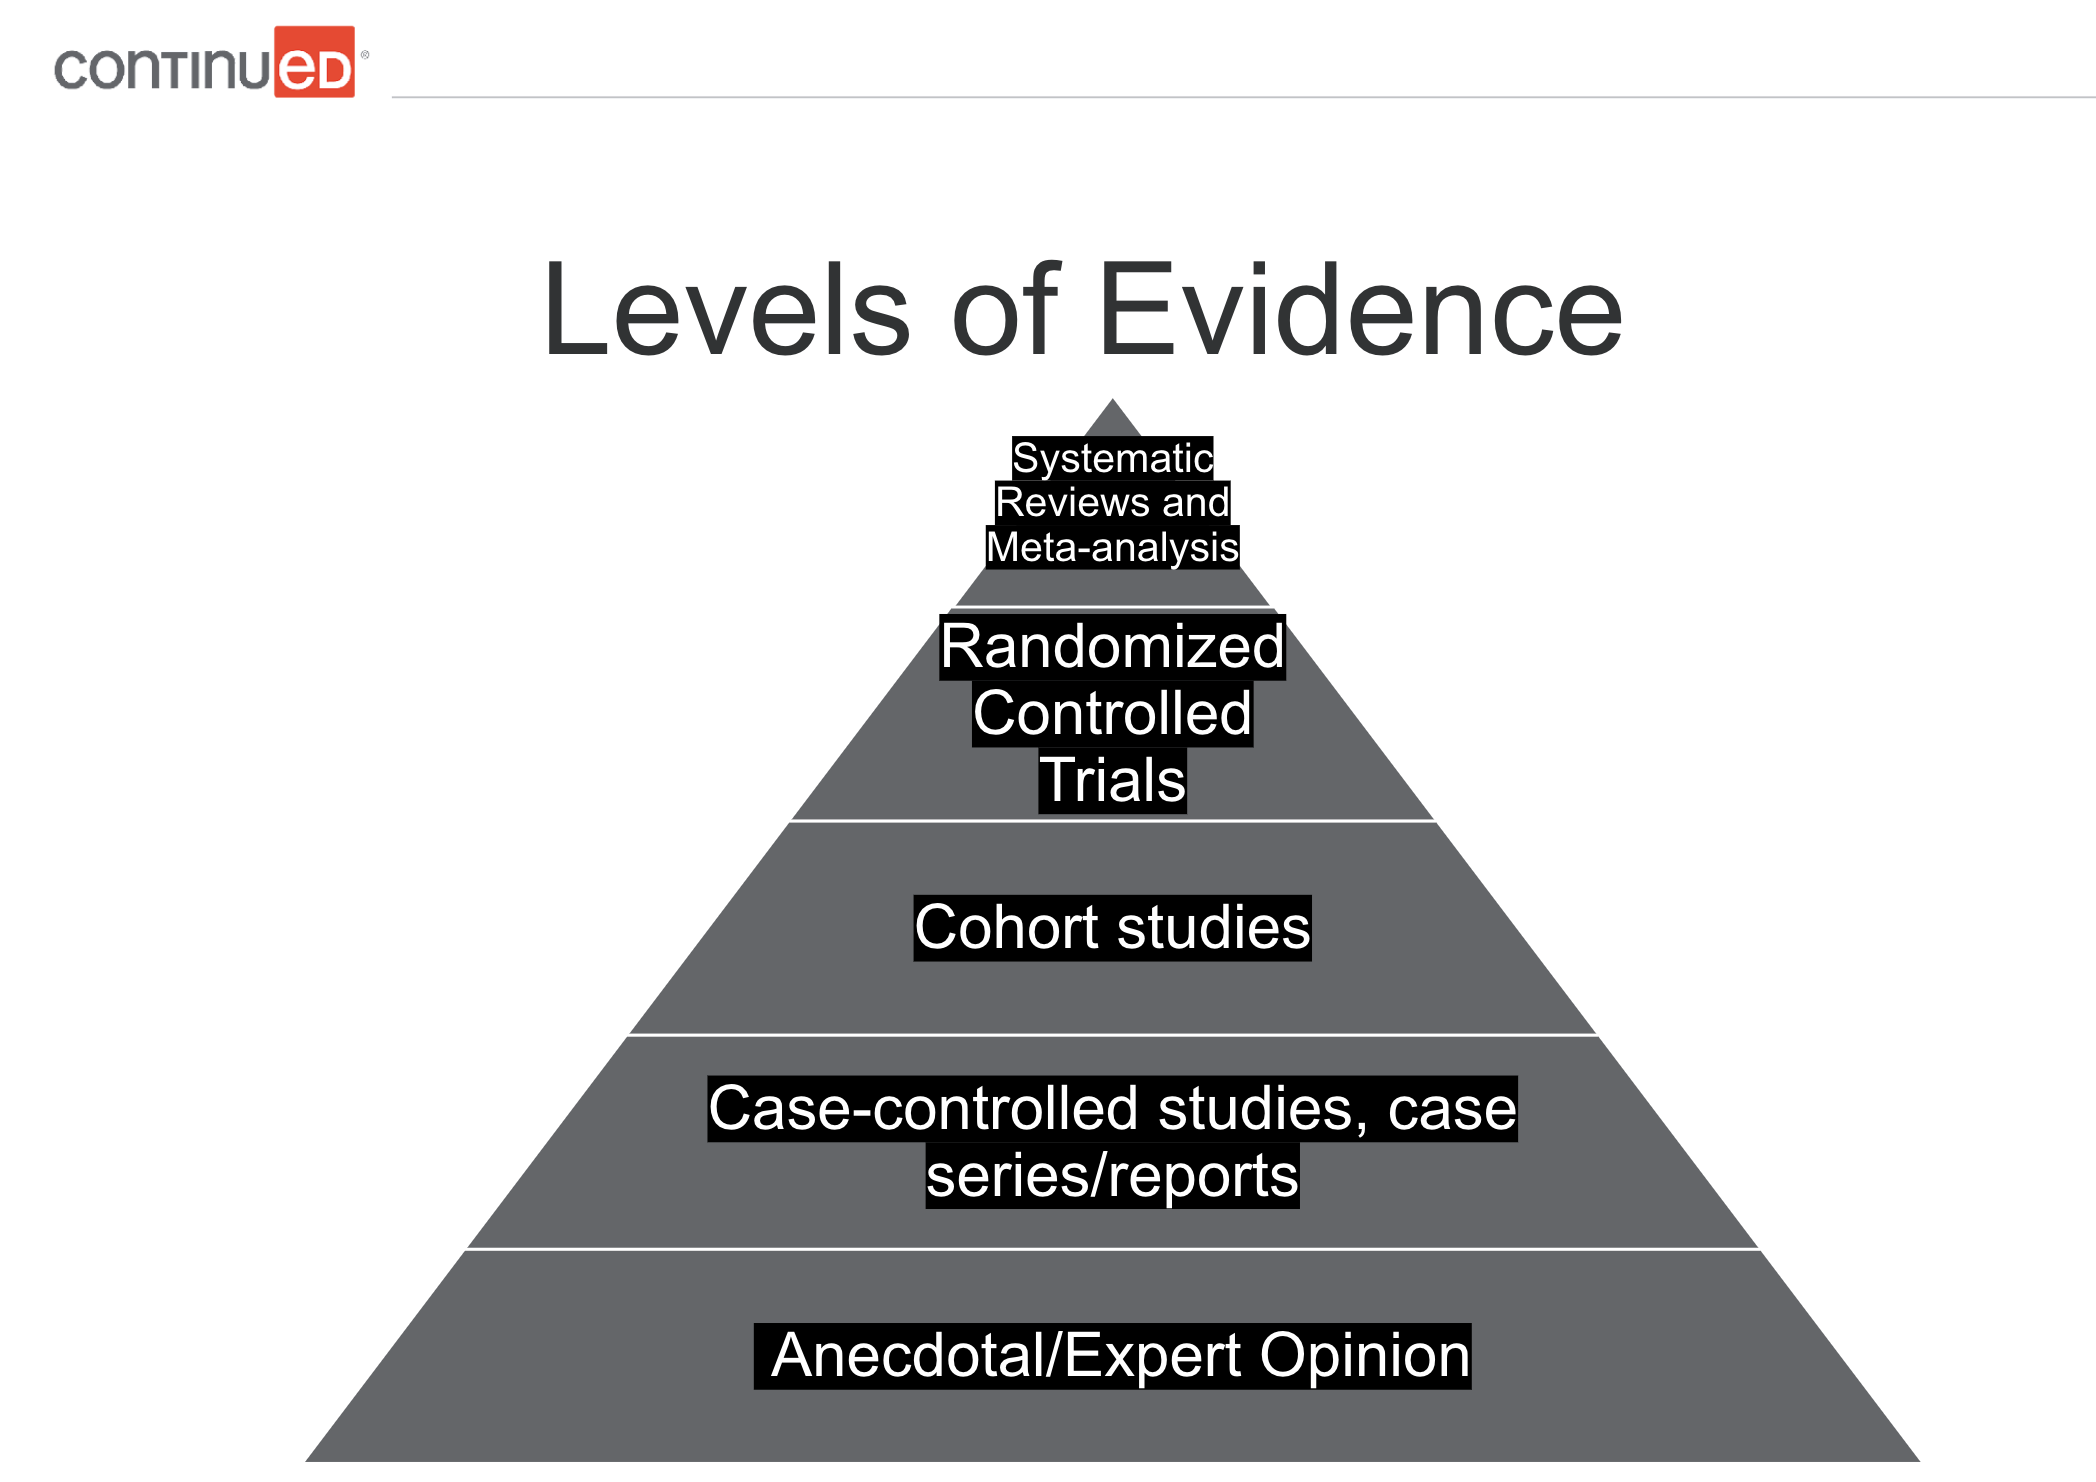
Figure 1. Levels of evidence pyramid.
The tip of the evidence pyramid represents the strongest level. The base is the lowest level. At the bottom, we have anecdotal expert opinion - one expert's view based on experience. It has some value but is the lowest level. Next are case-controlled studies, case series, and case reports. These detailed examinations of a case in a real-world context provide useful but limited evidence.
Above that are cohort studies comparing outcomes between similar groups with key differences.
Then we have randomized controlled trials (RCTs) - the "semi-gold standard." These are scientific experiments that compare interventions to a control group without the intervention. These are commonly used in the research for drugs, surgical treatments, devices, and procedures.
Systematic reviews and meta-analyses are at the top of the evidence pyramid. A systematic review gathers all empirical evidence on a topic using defined methods in an attempt to obtain answers to a specific question. A meta-analysis is a statistical analysis combining and comparing the results of multiple similar studies. Systematic reviews may include a meta-analysis.
Limitations are that many high-quality studies are needed for robust systematic reviews/meta-analyses. If a topic lacks enough quality research, these methods are less useful.
Other research terms/types include:
- Exploratory research: generates ideas and hypotheses
- Descriptive research: describes a phenomenon or population (e.g. consumer behavior).
- Correlational research: examines relationships between two or more variables; does not establish a cause-effect relationship
- Experimental research: manipulates one or more variables to establish a cause-and-effect relationship; the gold standard for determining causality
- Systematic reviews and meta-analyses: synthesize findings across multiple studies on a topic; overview of the available evidence and identifying areas where additional research is needed
Exploratory research is general research used to come up with ideas or a hypothesis. An example would be sending out a survey to figure out how common eating disorders are in today's youth. Descriptive studies are trying to describe a particular phenomenon or population. Examples are sales studies looking at consumer perspectives, behaviors, market characteristics, and analysis. Correlational research examines the relationship between two or more variables; the key here is correlational, not causational. Just because there is a relationship, whether weak or strong, does not mean that one thing causes another. For example, we can observe the relationship between alcohol consumption and unemployment without doing any experimental manipulation. We want to look at the relationship between those two things, without saying it is causal, which it may be, but it is not that type of study/research. Experimental research involves manipulating a variable and trying to establish a cause-and-effect relationship. Experimental research is what typically comes to mind when you think of experiments in a lab. Experimental research is the gold standard for determining causality. Again, systematic reviews and meta-analyses synthesize findings on a particular topic using multiple studies.
Common Research Terms
Here are some basic research terms, although it is by no means a conclusive list:
- Hypothesis: a testable statement or prediction.
- Independent variable: the variable that is manipulated by the researcher.
- Dependent variable: the variable that is measured or observed.
- Control group: the group in the study that is not exposed to an independent variable.
- Experimental group: the group in the experiment that is being exposed to the independent variable.
- Randomized controlled trial: Study where participants are randomly assigned to an experimental or control group.
- Placebo: Substance used as a control with no therapeutic effect.
- Double-blind study: A study where both the participants and the researchers are unaware of which group a participant is in. They don't know which participants are in the experimental or control groups, so they are unaware of who is receiving the placebo and who is receiving the intervention.
Example Experiment
To put those terms into context, let's make an example study. Our example experiment is not a good or ethical study, but the purpose here is to provide a simple guideline for understanding the common terms we just reviewed.
A quick side note about Institutional Review Boards (IRBs). IRBs were created to review the ethical and normative standards of a study and clear whether they should proceed or not. IRBs were first instituted in the 1970s specifically for biomedical and behavioral research, partly because of some of the atrocities noted in previous research. Prior to this time, researchers and the ones funding research were responsible for deciding ethically whether a study should or shouldn't be done or whether it was legal or not. You may be familiar with atrocities that were done in the name of science experiments by the Nazis in World War II. Regardless of whether anything was learned from those experiments, we would all agree that does not justify what they did to get that information. It was during the Nuremberg trials that it was first recognized that there was a need for some kind of a safeguard in research internationally, although to my knowledge laws about this were not passed until the 1970s. IRBs are an absolute must for most research. Even for our capstone projects in graduate school, we had to go through an IRB to ensure our studies were ethically sound.
Back to our example experiment. In this example, we believe a particular vitamin reduces the risk of death, so we will do a randomized control trial. We will randomly assign subjects to two groups. We will put vitamin supplements in the water bottles of one group, and the other group will receive the same water bottle with no added supplement. As researchers, we are not aware of which participants will receive the vitamin supplement and which will not, so we do not know who is in which group. Then, maybe after 50 years, we will compare the death risk between the two groups.
Now, let's return to our terms and see how they apply to this example:
- We believe a particular vitamin reduces the risk of death (Hypothesis).
- We randomly assign subjects to the two groups (Randomized Controlled Trial).
- We put vitamin supplements (Independent Variable) in the water bottle of one group (Experimental Group).
- The other group (Control Group) receives the same water bottle (Placebo) with no added supplement.
- The researchers were not aware during the study which participants were in which group (Double Blind Study).
- We compare the treatment and control groups' death risk (Dependent Variable).
Common Research Terms - Continued
Validity. Validity is the degree to which a study measures what it is intended to measure. There are different types of validity, including construct validity and content validity.
Construct validity is whether a test measures what it intends to measure. Content validity determines whether it represents what it aims to measure.
For example, say a company wants to use a survey to measure whether a customer is going to purchase its products. It sends out a survey to customers trying to find out their intent to buy a product. If the survey has good (or high) content validity, then it covers every topic related to their products and excludes all irrelevant topics. Regarding construct validity, does the survey really tell whether the consumer intends to buy a product? That's something you have to measure. To measure construct validity, companies use internet cookies. Once someone takes a survey, they will track that user to look at whether they end up purchasing a product. Then they could truly determine whether the survey reflects consumer behavior and whether it has construct validity; in other words, whether the survey told them what they wanted to know.
Reliability. Reliability is the degree to which a study produces consistent results over time or across different researchers or settings. There are different types of reliability. Test-retest reliability is the consistency of a measure across time. Do you get the same results when you repeat the measure over and over again? Interrater reliability is whether you get a consistent measure across different observers; if different people run the test, do they get the same or similar results and measurements? Internal consistency is whether the tool itself is consistent. Are different parts of the test measuring the same thing? For example, consider a survey or a personality test. You get asked similar questions in different ways, but they should result in a similar answer. Going back to our product survey example, if one question asked if they loved a particular product and they answered yes, and then another question later in the survey got a response that the person did not like the product, that particular survey would have a lack of internal consistency. The test is not producing the same results from different parts of the test.
Common Statistics Terminology
Common statistics terminology includes mean, median, and mode. Let's use this dataset as an example: 0, 1, 1, 2, 3, 5, 10.
The mean is the average. To calculate the mean, you total the numbers and divide it by the number of items in the dataset. The sum of these numbers in our example dataset is 22, and there are seven items in the data. The mean is 22 divided by 7, which equals 3.66666.
The median is the middle value. In this case, there are seven items in the dataset The median is 2, right in the middle, with three items on one side, and three items on the other side.
The mode is the value that occurs most often. In our example dataset, the mode is the number 1. The number 1 appears twice, which is more than any other item.
Each of these terms can tell you different things about the data and the distribution. You can imagine altering the dataset by adding higher or lower numbers, and how the mean, median, and mode may also change.
Statistical Significance v. Clinical Significance
When reviewing research, you may encounter the question - is it statistically significant? Statistical significance means the probability that the result occurred by chance is very low. Generally, you want a study to have statistical significance. However, statistical significance doesn't always equal clinical significance.
Statistical significance is a mathematical measure, while clinical significance refers to whether a change could meaningfully impact a patient. For example, let's say one study found a stretching technique was 1% more effective for range of motion and it was statistically significant. A 1% improvement may not justify changing your practice, especially if there are downsides to the technique like more pain or risks. While statistical significance is important in evaluating research, it doesn't guarantee clinical usefulness.
Sensitivity and Specificity of Testing
Sensitivity refers to the degree an instrument can detect changes to a measure or the ability of a test to identify patients with a particular disorder. Tests that are sensitive are useful for ruling out a disorder. In other words, people who test negative are more likely not to have the target disorder. The pnemonic I learned in school was SnNout: if a sensitive test has a negative result, you can rule out the target disorder. However, it can have high false positives.
Specificity is the ability of a test to identify patients without the condition in question. Highly specific tests help rule in a disorder; those testing positive likely have the target disorder. The pnemonic is SpPin: if a specific test is positive, it rules in the disorder. However, it may have more false negatives.
Ideally, tests would be both highly sensitive and specific. But this is rare, especially in physical therapy. So we may use clustering, combining multiple tests, as well as clinical prediction rules to improve accuracy.
For example, let's say we suspect subacromial impingement in a patient complaining of shoulder pain. We could use Neer's Test, which has a high sensitivity rating of .93. So if negative, we'd be fairly confident they don't have impingement. But a positive doesn't guarantee they do. Hawkins-Kennedy Test has a high specificity of 1.00. So a positive means they likely have impingement, but a negative isn't definitive. Using both narrows the probabilities. While not perfect, clustering tests improve our clinical decision-making.
Clinical Prediction Rules and Clinical Practice Guidelines
Clinical prediction rules (CPRs) are mathematical tools that help guide clinical decision-making. They build upon literature and expert opinion to provide quick and inexpensive estimates of probability. They assist in patient management when determining a particular diagnosis, or prognosis, or when predicting a response to an intervention. Researchers develop them by identifying predictive factors, testing them in different populations, and assessing the impact. They move through levels of evidence based on the research backing them. There is debate regarding the extent of their validity and clinical application, and this area is still evolving.
Many musculoskeletal clinical prediction rules are still in the early phases and lack sufficient validity for clinical use. Some exceptions, like spinal cord injury prognosis rules, have more justification. Caution is warranted in applying most to practice currently. Evaluate the validity prior to implementing CPRs.
Example CPR
An example with more evidence is using certain criteria to identify patients likely to benefit from spinal manipulation for low back pain (LBP):
Patients who received the most benefit from spinal manipulation for LBP meet at least four out of the five criteria below for spinal manipulation (Beattie & Nelson, 2006).
- Pain lasting less than 16 days
- No symptoms distal to the knee
- FABQ score less than 19
- Internal Rotation of > 35 degrees for at least one hip
- Hypomobility of a least one level of the lumbar spine
This can help to guide treatment.
Clinical Practice Guidelines
Clinical prediction rules differ from clinical practice guidelines (CPG). Clinical practice guidelines are systematically developed recommendations to assist practitioners with specific patient care decisions. Guidelines have more evidence and weight behind them than prediction rules, as they are based on a systematic review of clinical evidence. Many reputable guidelines exist through groups like the APTA to guide practice. These include conditions such as ankle stability and movement coordination for ankle strains. There are clinical practice guidelines on what outcome measures to use for patient neurologic conditions, diagnosis of upper quadrant lymphedema secondary to cancer, evidence-based knee and ACL injury prevention, hip and mobility deficits in regards to hip osteoarthritis, low back pain, neck pain, hip pain, pelvic girdle pain, shoulder pain, and many more.
Overall, clinical prediction rules show promise to aid clinical decision-making but require careful vetting. As research continues, their role in evidence-based practice should grow.
For example, I have relied on one for vestibular patients to help decide what types of intervention to provide. There is a good CPG with a summary of action statements. Basically, it goes through and gives recommendations and what level of evidence is behind them. One recommendation is the effectiveness of vestibular rehab in persons with acute and subacute unilateral vestibular hypofunction; clinicians should offer vestibular rehab with acute or subacute unilateral vestibular hypofunction. This tells us that vestibular rehab tends to get these patients better; the evidence level is level one (strong). It explains what that means. It describes who you should offer vestibular rehab to, and who you shouldn't offer vestibular rehab to. For example, clinicians should not offer circadic or smooth pursuit exercises in isolation as exercises for gait stability, the patients with unilateral or vestibular hypofunction. It explains what you should do, what you shouldn't do, and the strength of evidence. It will not dictate your whole plan of care, but it does give definitive statements of which people benefit from these types of interventions, and which do not, and shows how confident you can be in that. They are good general guides to consider as you develop your plan of care.
Clinical Practice Guidelines - Benefits to Therapists
- Easy access to synthesis of evidence from experts
- Promotes self-assessment of current practice approaches
- Help develop the direction of future clinical research
- Legitimize the profession and assist in advocacy
Clinical Practice Guidelines - Benefits to Patients
- Improve clinical outcomes and more effective interventions
- Increases standardization in clinical practice
- Provide greater cost-effectiveness
- Increases transparency of evidence in treatments
Using clinical practice guidelines benefits both therapists and patients. It's easy access to a synthesis of evidence; it's like having a systematic review break down exactly what you should and shouldn't do. Using them helps to promote a self-assessment of what you're currently doing. Are you doing anything that either doesn't have strong evidence or doing something that has strong evidence not to do? It helps to develop a roadmap for further research. Their use also helps to legitimize our profession and advocates for our services. We can show we're using evidence-based practice to guide our care. For patients, more effective interventions have better outcomes. Using clinical practice guidelines promotes standardization to some extent across clinical practice, and is more cost-effective. They also provide transparency regarding our treatments. If somebody asks you why you're doing something, you can clearly explain why and you have evidence behind its efficacy. See Moore (2011) for more information.
Misleading Statistics
Statistics can be manipulated, both intentionally and unintentionally. Here are some key ways statistics can be misleading:
- Cherry-picking data. This refers to selectively choosing data that supports your argument and excluding contradicting evidence. This can be done on purpose to tell a particular story, or sometimes confirmation bias can cause us to prefer some research and exclude other research. It is rare for research to be unanimous on a given topic, as that is the nature of research. It is important to look at the body of evidence as a whole.
- Using small sample sizes. A robust sample size is needed to apply the findings to the population at large. It is misleading to draw conclusions based on a small sample size that is not representative of the general population; studies with very few subjects are hard to generalize to larger populations. Larger samples provide more reliable conclusions.
- Stating that correlation is causation. Just because two variables are statistically related does not mean one causes the other. Other factors may be at play. One example is the correlation between ice cream sales and murder. If ice cream sales are higher in the summer, and more murders occur in the summer, we cannot conclude that eating ice cream causes murder. In the summertime, maybe more people are out and interacting and other factors are involved.
- Misleading visuals. Use of graphs, charts, or other visual representations to distort or misrepresent data, leading to false conclusions. Charts and graphs can distort data by manipulating scale, units of measure, axes, etc. Visuals should be scrutinized when evaluating statistics and research.
- Not reporting effect size. Stating that something is statistically significant without reporting the effect size can lead to overstating the importance of a finding. Effect size is another statistical tool to consider as it indicates the importance of a finding.
- Misleading averages. Using the mean or average of a data set without noting the distribution or variation can lead to inaccurate conclusions due to outliers or other irregularities.
Misunderstanding Statistics
Statistics are often misunderstood unintentionally. There are significant dangers in not understanding, misapplying, or poorly manipulating statistics. There are cases of statistical errors changing the course of human history.
Prior to the launch of the Challenger in 1986, engineers had expressed concerns about the safety of O-ring seals at low temperatures that were predicted during their launch (Tappin, 1994). The weather was going to be unseasonably low. Engineers had data that showed at previous launches there was damage to O-rings at low temperatures. The problem was, there were very few launches at low temperatures so they felt it was very difficult to draw conclusions about how exactly they would perform. They thought the risk was probably higher, but they didn't have a lot of data at low temperatures. Their data was incomplete. They had a small sample size. Also, data from high temperatures was not included because they thought it was irrelevant. There had been O-ring failures at both high and low temperatures, but the strength of the association between those two variables had not been measured. That may have enabled them to predict the risk at low temperatures with greater accuracy.
What happened was a terrible tragedy: 73 seconds into the flight, several O-rings failed, pressurized gas escaped, and the shuttle was destroyed, killing all seven crew members. Following the disaster, a statistical flaw in the decision-making process was identified as one of the contributing factors. In fact, it was later calculated that at a temperature of 31 degrees at launch, there was a 99.6% chance of at least one O-ring failure. Had they had this information, it may have affected the decision to launch. NASA has since prioritized statistical and risk analysis of each shuttle component. See Tappin (1994) for more information.
It is important for researchers and consumers of research to be aware of the potential for manipulation and to approach statistics with a critical mindset. Be sure you fully understand the data you are using. As physical therapists and physical therapist assistants, we have a responsibility to help our clients get better, avoid adverse incidents, and provide a high level of care. Though not literally life-or-death like NASA, our choices significantly impact patients' well-being and outcomes.
How to Break Down Research and Examples
Ways to access research:
1. Online databases
2. University libraries
3. Professional organizations
4. Open-access and print journals
5. ResearchGate
6. Preprint servers
7. Government agencies
The larger online databases like PubMed are great resources. Google Scholar has better exclusion criteria than a simple Google search, but you have to carefully review what you find on Google Scholar, too. We should also include Shirley Ryan Ability Lab as a good resource for outcomes measures. They have data available for PTs and PTAs, and information on how to perform an outcome measure, cutoff scores, minimum detectable changes, and more. University libraries and professional organizations like APTA have access to research through their website. There are many different open-access and print journals. ResearchGate is kind of a social networking site where they share research articles. As we go further we go down this list, and the more caution you have to have with the information. Preprint servers enable people to share research before it's completed. Government agencies such as the NIH and CDC provide access directly to some of their related research items.
Common Research Article Components
The basic components of a research article are:
- Abstract: Contains purpose of study, research question, and main findings with conclusion
- Methods: Design, techniques used for gathering data
- Results: Presentation of the findings
- Discussion: Review of introduction, evaluation of results
- Recommendations: Proposal for something that should be done based on the findings
- Limitations: Weaknesses of the research
- Conclusion: Final thoughts and summary of the whole work
This is not an exhaustive list as studies will have different components, and there are key pieces (outlines, literature reviews, etc.) not included here.
Considerations When Reading Research Articles
There are different ways to break down research. I will provide you with how I go about it, and over time you can develop your own method that works best for you.
Identify the thesis and read the abstract. Oftentimes, the first thing I'm looking for is, does the topic play a role in my area of practice? If not, I may not spend a lot of time on it. I also ask, "What was the primary aim of this study?", to see if it aligns with my plan of care.
Review the methods. Are there any red flags as to the way they gathered the information? You may not understand statistical tools yet, but at least you can look at how they gathered evidence and see if there are any biases or red flags.
Identify the sources. Consider, was this published in a well-respected journal that is peer-reviewed? Even that does not guarantee good data. Also, determine if there is any bias in the source of funding. Do the people who created the study or paid for the study have any stock in the outcome? If so, that doesn't automatically invalidate the results, but certainly, that should be a consideration. For example, if the study found a lot of benefits of eating red meat and it was funded by a dairy council or ranchers, you would consider if implicit bias affected the results of the study.
Consider the year of publication as we know research evolves. Something that research told us years ago may shift and change over the years, which is sometimes used as a criticism of research. Research that holds true today may not be true in 10 years, but that's the nature of the process of gathering information over time. Be cautious when you read research more than 5 years old, as there may be newer evidence that refutes it.
Identify the study design. Recall our pyramid for identifying how evidence is ranked in terms of strength. A strong study is at the top of the pyramid. If it falls at the lower level of the pyramid, you need to apply the appropriate filter when reading the study as the evidence is not as strong.
Look at the sample size. If it is too small it may be a chance finding. Likewise, if the sample size is too large, it might be statistically significant, but may not be clinically relevant or have the right effect size.
Consider the data collection process. Is the sample representative? Does it tell the story they're telling or prove what they are trying to prove?
Determine the actual statistical analysis used. This is more complicated and beyond the scope of this introductory course. If you take further courses in research, you will look at applying different tests such as ANOVAs, t-tests, chi-squares, and others. You will learn if a statistical tool was the right tool to use, which will provide you with further insight into the research you read.
Analyze the results. Evaluate the statistical significance of the results. Ask the following questions: What is the provided answer to the research question? Is the conclusion supported by the data presented? Are the study limitations discussed? I've read studies where there is a conclusion, but it does not align with how I would have interpreted the data.
Finally, consider the implications. If it is a good, strong study, how can these findings be applied to patient care? And is it enough? Is there additional research needed?
Breaking Down a Research Article
Be skeptical - don't reject or become cynical about research, but approach findings with a critical, questioning mindset. Never accept conclusions or headlines at face value. We often see sensationalized headlines about health studies that distort or exaggerate the research. Always scrutinize conclusions and ask questions about all aspects of a study - methods, data, conclusions. You can evaluate the strengths and weaknesses critically and extract the truly meaningful data. This skill of healthy skepticism protects us and ensures research reliability and validity. It leads to differentiating high-quality studies with cautious, nuanced conclusions from weaker studies overstating their implications. As clinicians, we must hone this ability to parse quality research from exaggerated claims. Headlines and summaries often omit key details, but digging deeper reveals the real value of findings and guides appropriate application.
Not All Studies Are Created Equal
We know good examples of research include randomized controlled trials (RCTs), both with large sample sizes, clear inclusion criteria, and controlled interventions. Meta-analyses, which we talked about earlier, are good examples of strong research. Observational studies can be good as long as they have a well-defined population, clear outcome measures, and strong statistical analyses. A qualitative study, even though on the lower level of the evidence pyramid, can still have good value if it uses a rigorous data collection and analysis approach.
Bad examples include studies with small sample sizes that lack statistical power, poorly defined inclusion criteria, and flawed designs such as having selection biases or confounding variables. It also includes studies with poorly executed data analyses, such as errors in measurement or analysis, which limits the reliability of the findings. You may need a statistician to determine that, which is why it is best to look at studies that are well-reviewed and well-established.
Research Example
In 2013, the Journal of the American Medical Association (JAMA) published a meta-analysis of 100 studies that examined the relationship between body mass index (BMI) and mortality (Flegal, Kit, Orpana, & Graubard, 2013). Their findings found slightly overweight people have lower all-cause mortality than normal weight and underweight people. This was a shocking finding. It is not something we would expect to hear based on current knowledge; the assumption would be that being a normal weight or underweight is healthier than being overweight.
So let's look at the study. JAMA is a well-respected journal. The data sources were researched from meta-analyses in PubMed and EMBASE electronic databases. Those are good data sources.
In terms of study selection, it included 100 articles that reported Hazard Ratios (HR) for all-cause mortality using BMI categories. It excluded studies that used nonstandard categories, that were limited to adolescents, and those with specific medical conditions/procedures. So far, there is no reason for criticism.
The results stated that random-effects summary all-cause mortality, HRs for overweight, obese, grade 1 obesity, grade 2 and grade 3 obesity were all calculated comparative to normal weight. This seems like a reasonable comparison.
It is worth noting that this is a correlational study, not a causational study. It is not a randomized controlled trial - they are not making people overweight or underweight and then studying their mortality. There would be ethical issues about doing a randomized control trial on a topic like this, which is true of many topics. We are sometimes limited to trying to make connections with correlational research.
In their conclusions, the study stated: “Relative to normal weight, both obesity (all grades) and grades 2 and 3 obesity were associated with significantly higher all-cause mortality. Grade 1 obesity overall was not associated with higher mortality, and overweight was associated with significantly lower all-cause mortality.”
Relative to normal weight, both obesity, grades 2, and grades 3 were associated with higher all-cause mortality, which makes sense. Grade 1 was not associated with a higher mortality, and overweight was significantly lower, which does not seem to make sense.
And, we have found minimal to no red flags so far. The red flag for me is, that this is the first study I've ever seen that says being overweight might mean your risk of death is lower. My initial skepticism left me wondering why, if this were true, we had not seen evidence of this before. My thought was to wait for reliability before believing these results.
Eventually, researchers examined this study closely and did find issues (JAMA, n.d.). The selection criteria used ruled out a significant percentage of available studies. Even though they had looked at 100 studies, it was later found that high-quality studies representing 6 million people were ruled out. If they hadn't ruled those out, they would have had twice as many as those represented in the JAMA study. When these studies were included, the results showed that the highest survival rates were in normal-weight people.
They also found out that they improperly adjusted based on controls for only healthy individuals. They tried to exclude people who were unwell but they did end up including people who were chronically ill including smokers and elderly. This included slim people who may have been dying of cancer or old age. That skewed the data.
The tricky thing is the study was already published, and the headlines ran with it. It alters the credibility of research when the media runs with these headlines because the average consumer may not understand the evolution of data or how research works. They end up dismissing all research because they read conflicting statements. There may be people who made lifestyle changes (or did not make lifestyle changes) based on these headlines alone. This is just one example of many. There are other examples of headline-grabbing research that were later refuted, but the damage was done as the information was widely disseminated. These kinds of scenarios create distrust in research in general.
How to Apply Research to Your Practice
It can be challenging to apply research to your practice. Try and integrate it into the day-to-day aspects of practice. Starting the conversation with the rest of the team is key to getting everyone on the same page. Journal clubs are helpful, especially if you have students. When people are APTA members or members of a specialty organization, they are probably exposed to evidence-based practice and research. Choose your CEUs that focus in on a specialty, or a certification of some kind. It will require a deep dive into research to pass specialty courses and exams. The APTA has created more specialty programs with a PTA focus, providing advanced proficiency pathways in certain areas such as geriatrics. These are a good way to advance your profession and stay up to date with the latest in evidence-based care.
De-implementation
De-implementation, the process of removing low-value or inappropriate healthcare approaches, is as important as adding evidence-based care. Often, the best approach is to consider a process of de-implementation of an unfavorable practice while simultaneously implementing a better replacement. Some common targets are modalities with limited evidence and traditionally used techniques like craniosacral therapy and NDT that research increasingly refutes. Letting go of cherished approaches we've invested in requires open-mindedness, even when it contradicts anecdotal experiences. If skills lack evidence, we must honestly consider whether they are the best use of our expertise compared to alternatives that could better serve patients.
Implementing evidence warrants caution too – resist applying a single study's results immediately or applying it to the wrong population. Evidence must pass through the knowledge translation process: Findings require replication across multiple sources and vetting by accrediting bodies first. For example, one therapist eagerly tried a new e-stim protocol for quad strength after knee replacement. However we couldn't replicate the parameters, and it took excessive time from other needed interventions despite only slight improvements over the control group. The evidence wasn't ready for clinical implementation yet. The lesson here is to be careful of jumping in too quickly when you see exciting research emerging.
Knowledge translation is key – the process of taking knowledge generated by research and making it accessible and applicable to those who can benefit from it. It is an evolving process of evaluating, synthesizing, disseminating, implementing, and re-evaluating the information. The knowledge translation process is used to inform policy, practice, and decision-making in relevant fields. There are 7 action phases (Identify a Problem; Adapt Knowledge to Concept of the Problem; Assess Barriers to Use; Select, Tailor and Implement; Monitor; Evaluate Outcomes; Sustain Knowledge Use), which sequentially or simultaneously can influence the action phases at any point in the cycle (Welch et al., 2013). Refer to the course handout for a graphic illustration of this process.
The knowledge translation process synthesizes research into practice recommendations. It considers the quality and applicability of evidence to guide adoption decisions. For instance, high-quality evidence showing an intervention improves outcomes significantly and feasibly would warrant quick adoption. But poorer quality evidence or smaller gains might justify waiting for more research. Knowledge translation optimizes implementing proven approaches while avoiding fads. A thoughtful, structured process is crucial when research constantly emerges.
For example, say I identify a problem in my population. I have poor outcomes in my skilled nursing facility. I adapt the available knowledge and find a lot of research that high-intensity exercise is effective and safe in this population. I assess what the barriers are, which are fear, adverse incidents, and change. I select, tailor, and implement practices based on the research guidelines, safety measures, and clinical knowledge. I monitor how it's going and what the risks are. I evaluate the outcomes; if it has the outcomes I want, I can incorporate them as a standard part of care for appropriate clients.
What if My Facility Does Not Use Evidence-Based Care?
This can be challenging, especially for PTAs without leadership roles. If your PT or team resists evidence-based practice, changing mindsets is difficult. Start with an open mindset, not an adversarial one. Use active listening to understand barriers, then try addressing misconceptions. Reference recommendations from accrediting bodies to support your view. Share evidence showing how outcomes, quality, and efficiency would improve. Frame it in terms they relate to.
Progress may be slow - keep presenting information positively. Leadership roles allow for implementing change more easily. For research focus as a PTA, consider your setting but some broad areas are technology, effective interventions, and dosing methodologies. Resources like specialty section publications and white papers explaining topics can help. Clinical prediction guidelines are very useful.
While PTA involvement in direct research is limited, assisting teams with data collection, analysis, recruitment, etc. is feasible and valuable. Leading research typically requires a PhD but clinical partnerships with academia can open doors. Sharing case studies and posters at conferences provides opportunities too.
Stay skeptical of research claims, keep skills updated using research, and get involved with APTA or other professional organizations for leadership growth. A critical but open-minded approach, along with persistence, helps promote evidence-based practice.
Questions and Answers
Can you explain sensitivity and specificity again?
Sensitivity refers to a test's ability to correctly identify people who have a disease or disorder. A highly sensitive test will rarely miss cases. So if someone tests negative on a highly sensitive COVID test, they are very likely to not have COVID. However, highly sensitive tests can still have some false positives - people testing positive who don't actually have the disease.
Specificity refers to a test's ability to correctly identify people who do not have a disease or disorder. A highly specific test will rarely mistakenly diagnose people as having a disease when they do not. So if someone tests positive on a highly specific COVID test, they very likely have COVID. However, a highly specific test may still miss some cases - people testing negative who actually do have COVID.
The ideal test has both high sensitivity and high specificity. But some tests excel at one over the other. Understanding whether a test favors sensitivity or specificity allows you to better interpret negative and positive results. Visualizing this trade-off between sensitivity and specificity can help grasp these concepts. I suggest finding explanatory YouTube videos and drawing it out yourself to fully comprehend sensitivity versus specificity.
For PTAs, what conflict resolution techniques can you offer when working with PTs who aren't open-minded towards evidence-based practice?
This is tough. I'm not a PTA, but I did go into practice as a new physical therapist trying to implement change with older, more established clinicians who used more traditional approaches and techniques. My approach was not to be confrontational, and to try and start a discussion about research. It was important to understand their point of view. You need to have a starting point, and a good dialogue if you want to change people's minds. Slowly, over time, you can sometimes get people to have conversations, and to be more open-minded. But if you come at it from an adversarial conflicting standpoint, you will not change people's minds. Focus on your own practice at first and sometimes when your outcomes show better results that may speak for itself.
Also, it is helpful to have someone in leadership who can show the practice why it is needed to implement or de-implement certain practices. However, if the person in leadership does not want to change, it is more challenging. Use the evidence at hand to show that with evidence-based practices, people are getting better faster, and their outcomes are better. When you are a rehab director or in a leadership position, you can implement research and explain why. Imagine a practitioner using one particular intervention for 20 years and anecdotally seeing their people get better, then being shown a bunch of articles saying that intervention doesn't really work. That would be hard to accept so be sensitive to that as you try and move other clinicians to evidence-based practice. It is definitely a challenge.
How do you know when specific research study results have gone through the APTA or other trustworthy authorities prior to implementing any new practices?
The best way to know if research has gone through the APTA is if it's an official APTA clinical prediction rule or guideline, often produced by specialty sections. Just because something hasn't gone through the APTA doesn't mean you should exclude it. There is valuable research on high-value topics from other sources that are not necessarily direct APTA components.
You mentioned high intensity for improved outcomes. How do you apply that to gait?
I have done a course on high-intensity exercise and high-intensity gait for PhysicalTherapy.com, entitled High-Intensity Exercise in the Older Adult. I recommend that you view that course for more details.
One of the big evolutions of my practice was implementing high intensity. My wife got involved with clinical prediction guidelines for high-intensity gait in subacute and chronic SEI and stroke patients. She was able to implement that within her clinic and they got excellent outcomes. The research behind it is strongly supported, but only within the last five to 10 years has high-intensity type dosing started coming into the skilled nursing facility (SNF) realm, which is my focus. The results are very strong in SNFs also.
I took a Combined Sections Meeting course on high-intensity gait in skilled nursing facilities. At first, I was adversarial, thinking that my patients were already getting better and that it sounded ridiculous. But they made me ask a lot of questions about my own practice. One was, what was my current dosing methodology? In the SNFs, it is easy to fall into a poor dosing methodology or to not have a dosing methodology.
High-intensity programming involves gait programming specifically. What was the intensity of my current gait training? Was I calculating heart rate percentage? Was I using Borg? Was I using any kind of outcome measures specifically to measure the intensity for gait? I was kind of going to failure or picking a distance that seemed functional for them or was moving toward their goal, but I wasn't measuring the intensity of the actual intervention itself. For all I know, I could have already been doing high-intensity.
I had my wife for support in terms of actually implementing high-intensity. The first step was making sure I did my due diligence on research. I ensured there was evidence that it could be performed safely in my population specifically and that it was effective. There is plenty of research, especially with older adults and high-intensity exercise, and high-intensity gait. I synthesized the research and took it to the medical professionals in our skilled nursing facility, including the medical director and the nurses. I made sure they had an understanding of it and were comfortable with it. We talked about the parameters I thought we should work on and made sure they were on the same page.
I started there and was very up-front with the patients during my evaluations. I said, this is what I would recommend; we have a couple of options. We can do this intervention, dose it at this intensity, or try a higher intensity, which has been shown to have better outcomes in less time. It may be more uncomfortable, and you will work harder, but this is the pros and cons list. I gave my recommendation, but I wanted to make sure it fit what they wanted and their goals for patients who could actively make that choice.
Make sure you have a dosing methodology now. We started closely tracking heart rate response and modified Borg in all of our interventions to see how we were dosing. There were some people who were doing high intensity and didn't even realize it because they weren't tracking heart rate during sessions or asking for a Borg score. If we had intended to do moderate intensity, then obviously we should adjust our parameters and ensure we're measuring it and providing that methodology. The next step was to implement high intensity very carefully when it was appropriate and for people who could agree to it. We ran our sessions through protocols recommended by the research and monitored them. We went through the knowledge translation process; we monitored results and then reevaluated at the end of a few people's plans of care. We looked at the outcomes and our initial results were great.
Certainly, not everyone makes it through; some people don't tolerate that intensity well and may choose to do a lower intensity. But the people who were able to do it and got through had the best results. That is not enough to say that it is the most effective, because other variables could impact the outcomes. However, because our outcomes were good and we had no real negative results, I would say the program was effectively implemented. And I think it will improve our outcomes in the long run because that is what we see in the research.
Again, refer to the PhysicalTherapy.com course for more details. And to summarize, make sure you know how you're dosing your interventions now, not just gait, but everything. It gets a little tricky with balance, but there are dosing methodologies for balance as well. If you feel like high intensity is applicable for your patients, then make sure you're doing it in the structure that's supported by the research.
References
Select references are included here. Refer to the course handout for the full reference list.
Beattie, P., & Nelson, R. (2006). Clinical prediction rules: what are they and what do they tell us? Aust J Physiother, 52(3), 157-63. https://doi.org/10.1016/s0004-9514(06)70024-1
Flegal, K.M., Kit, B.K., Orpana, H., & Graubard, B.I. (2013). Association of all-cause mortality with overweight and obesity using standard body mass index categories: A systematic review and meta-analysis. JAMA, 309(1), 71–82. doi:10.1001/jama.2012.113905
Jama Network. (n.d.). Retrieved April 19, 2023 from https://jamanetwork.com/journals/jama/fullarticle/1555137
Tappin, L. (1994). Applications: Analyzing data relating to the challenger disaster. The Mathematics Teacher, 87(6), 423-426. https://doi.org/10.5951/MT.87.6.0423
Welch, V, A., Petticrew, M., O'Neill, J., Waters, E., Armstrong, R., Bhutta, Z. A., Francis, D., Koehlmoos, T. P., Kristjansson, E., Pantoja, T., & Tugwell, P. (2013). Health equity: Evidence synthesis and knowledge translation methods. Systematic Reviews, 2(43). https://doi.org/10.1186/2046-4053-2-43
Any errors in transcription or editing are the responsibility of Continued.com and not the course presenter.
Citation
Cezat, K. (2023). Breaking down research for the physical therapist assistant. PhysicalTherapy.com Article 4875. www.phyiscaltherapy.com