Introduction
- Prevalence: 6-fold increase in the U.S. since 1980, per CDC
- 5.7 million in 1980
- 34.2 million in 2018
- Diabetes affects ¼ of older adults (≥65 years).
- Prediabetes affects about ½ of older adults.
- Therapy professionals are front-line providers.
Diabetes is occurring at epidemic rates in the US and is increasing worldwide. In the U.S., the prevalence of diabetes is more than six times greater now than it was in 1980, according to the US. Centers for Disease Control and Prevention (CDC). The prevalence was 5.7 million in 1980 and was up to 34.2 million in 2018. Diabetes is particularly prevalent among older age groups; it affects more than one-quarter of older adults (age 65 years and older). Pre-diabetes affects roughly half of US adults in that age group. As therapy providers, we are on the front line of helping stem this epidemic. We hope that this course will help you focus on good care for your adult patients with diabetes and will also give you a renewed confidence in making a difference in their lives. Now, before we delve into the specifics of therapy intervention for patients with diabetes, let's review the basics of the current understanding of diabetes and take a look at some recent updates.
Definitions
Diabetes mellitus is:
- “A heterogeneous, complex metabolic disorder characterized by elevated blood glucose concentrations secondary to either resistance to the action of insulin, insufficient insulin secretion, or both.” Endotext (online endocrinology textbook)
- “A chronic metabolic disorder marked by hyperglycemia. DM results either from failure of the pancreas to produce insulin (type 1 DM) or from insulin resistance, with inadequate insulin secretion to sustain normal metabolism (type 2 DM).” Taber’s Cyclopedic Medical Dictionary
- “A group of metabolic diseases characterized by hyperglycemia resulting from defects in insulin secretion, insulin action, or both.” American Diabetes Association
First, a note about pronunciation: you may hear "mellitus" pronounced with the accent on the first syllable (MELL - itis) or the second (mel - AYE - tis). Both are correct. Now, let's review the definitions of diabetes mellitus (DM).
Endotext, a great online endocrinology textbook, tells us that diabetes mellitus is: "A heterogeneous complex metabolic disorder characterized by elevated blood glucose concentrations secondary to either resistance to the action of insulin, insufficient insulin secretion, or both."
Taber's Cyclopedic Medical Dictionary defines it as: "A chronic metabolic disorder marked by hyperglycemia. DM that results either from failure of the pancreas to produce insulin in Type 1 or from insulin resistance with inadequate insulin secretion to sustain normal metabolism in Type 2."
Finally, the American Diabetes Association definition is: "A group of metabolic diseases characterized by hyperglycemia resulting from defects in insulin secretion, insulin action, or both."
Major defining components of diabetes mellitus:
- Metabolic disorder (or groups of disorders)
- Hyperglycemia (elevated blood glucose concentrations)
- Due to defects in insulin secretion and/or insulin action
The major defining components of diabetes are: 1) it is a metabolic disorder (or group of disorders); 2) it is characterized by hyperglycemia (elevated blood sugar glucose concentrations), and 3) it is due to defects in insulin secretion and/or in insulin action. Diabetes is a complex disorder. A few things stand out when we think of diabetes, including obesity. This is a really important factor for many Americans in the development of diabetes, and we will talk more about it later in the course. We also need to be sure that with our specific patients, we know which type of diabetes is involved, whether it is Type 1 or Type 2. We will need to know which parameters they are dealing with in terms of their diabetes.
History
- Signs and symptoms described >3,000 years ago in Egypt, India, China, Persia
- Sushruta—physician in India, 5th century BCE—described madhumeha (“honey-like urine”)
- Ancient Greece—term diabetes appears (Greek, “siphon or pass through”)
- Aretaeus of Cappadocia—Greek physician, 2nd century AD—established use of diabetes, provided first in-depth written description of clinical features and mortality
- Thomas Willis—English physician/anatomist, 1674—description of “the pissing evil.” Added mellitus (Latin, “sweet like honey”) to diabetes.
We will now take a brief walk through history. We have been aware of diabetes for a very long time. Manuscripts have been found going back over 3000 years from places like Egypt, India, China, and Persia in which ancient physicians described signs and symptoms that were consistent with diabetes mellitus. In around the 5th century BCE, the Indian physician Sushruta identified madhumeha, which means "honey-like urine." Somewhere along the line, the term diabetes began being used to describe the condition in ancient Greece. Diabetes is a Greek word that means literally to "siphon or pass through," which was in reference to the excessive discharge of urine that is associated with the disease. In the 2nd century AD, Aretaeus of Cappadocia, who was a Greek physician, established the use of the term diabetes. He also provided the first in-depth written account of the disease in which he described diabetes clinical features and its fatal outcomes.
After that, not much changed for more than a millennium. In 1674, Thomas Wilis, an English physician, and anatomist wrote a treatise on a condition that he called "the pissing evil" due to excessive urination that the patients experienced. He used the term diabetes and added the word mellitus, a Latin word meaning "sweet like honey," in reference to the sweet urine of patients with the disease. On a side note, if the name Thomas Wilis rings a bell, that's because he also described and illustrated the vasculature at the base of the brain, which we still call the "Circle of Wilis" today.
Classifications
WHO, 2019
There are several different classifications that are widely used, but I want to focus today on the 2019 classification from the World Health Organization, or WHO (Figure 1). This was a new classification at that time.
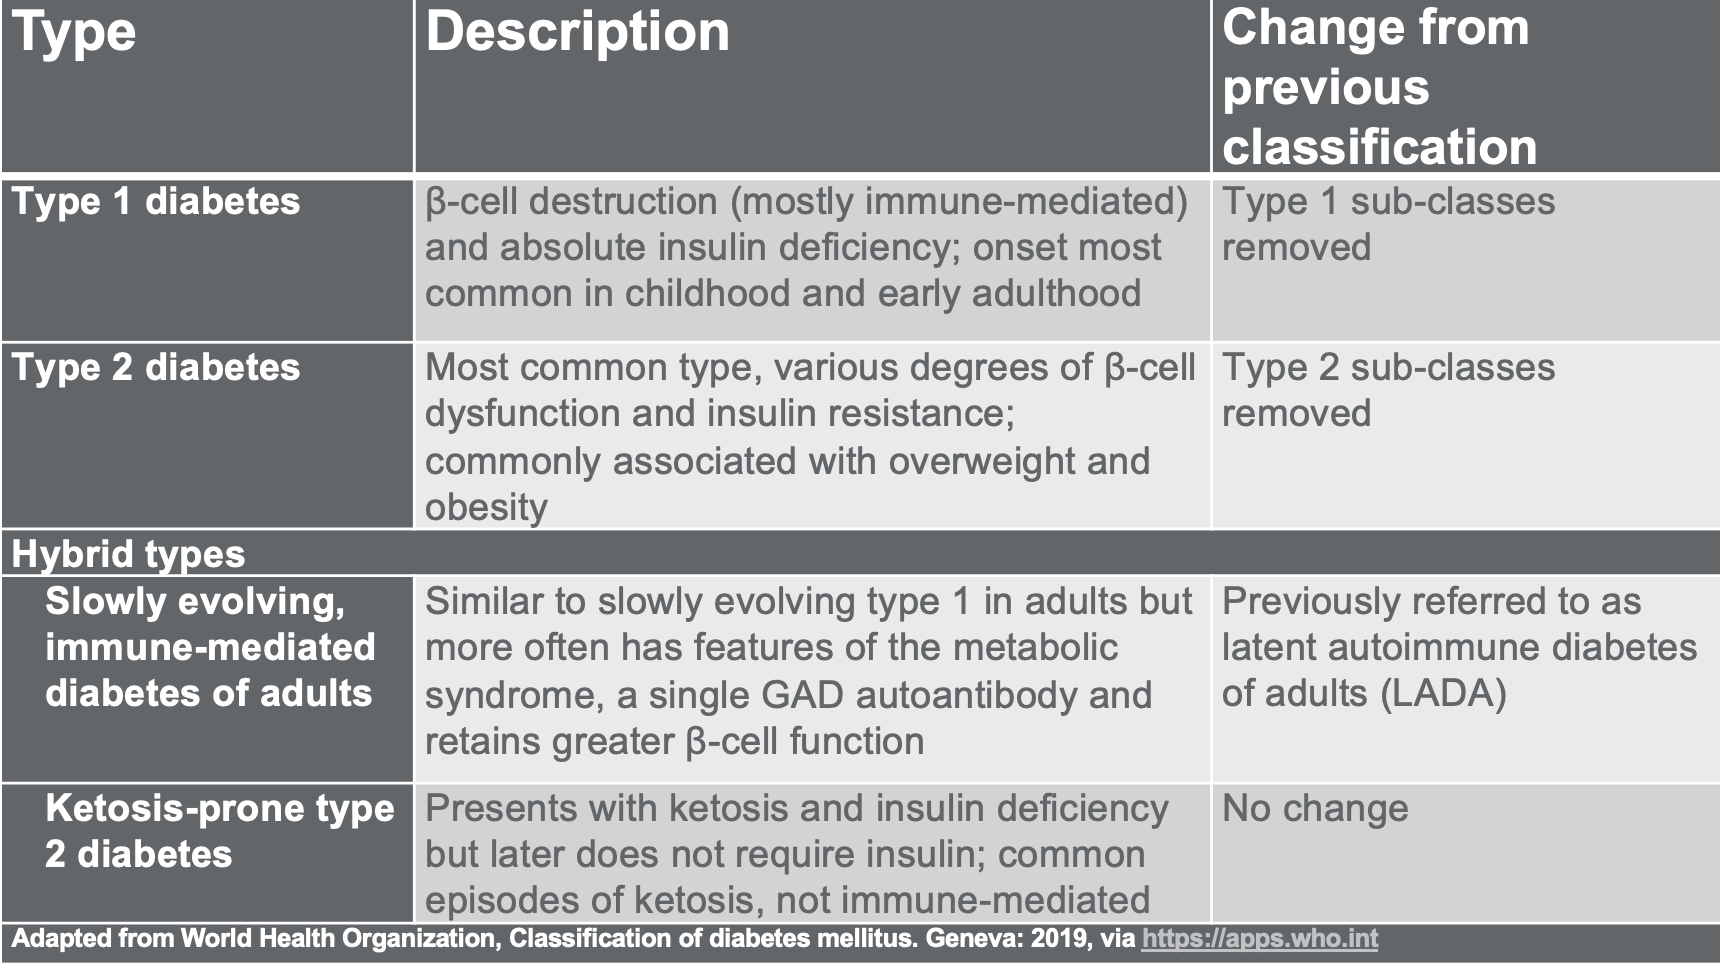
Figure 1. Classification - WHO, 2019. Adapted from the WHO, Classification of diabetes mellitus via www.who.int/en/
As you can see in Figure 1, WHO lists two main types of diabetes, Type 1 and Type 2, and then they also list two hybrid types. The first of these hybrid types is called a slowly evolving, immune-mediated diabetes of adults. The second one is ketosis-prone Type 2 diabetes. The slowly evolving type is actually a name change - it was previously referred to as "latent autoimmune diabetes of adults," which it is still called that by the American Diabetes Association and some other organizations. You will see both of those names used.
In addition to reviewing this chart, you may want to read in more detail the WHO descriptions and definitions because the information is important when you work with patients. You can find more information at the WHO website at this link: https://apps.who.int/iris/handle/10665/325182.
In addition to those main categories, the WHO had three other categories in this 2019 classification:
- Other Specific Types: related to monogenic defects, endocrine or pancreatic disorders, infection, drug reactions, and genetic syndromes
- Unclassified—temporary designation (until a more clear diagnosis can be made)
- Hyperglycemia First Detected during Pregnancy
American Diabetes Association Categories
Another very commonly used classification system, especially here in the US, is from the American Diabetes Association, which lists four main categories:
- Type 1
- Type 2
- Other Specific Type
- Gestational Diabetes
Most other classification systems for diabetes may have different types of essentially the same thing. There are a few variations, so you may hear terms that are somewhat different from what we have talked about here.
Type 1 DM
- AKA insulin-dependent diabetes; previously called juvenile diabetes
- More common in children, teens, young adults
- Characterized by “an absolute deficiency of insulin secretion,” per ADA
- 5-10% of all diabetes diagnoses
- Pathogenesis:
- Destruction of the insulin-producing beta cells in the islets of Langerhans in the pancreas
- Destruction of the beta cells → loss of insulin production → no insulin released into the bloodstream → insulin not available to cells
- Often described as an autoimmune disease rather than solely a metabolic disorder
Let's talk first about Type 1 diabetes mellitus. This is also known as insulin-dependent diabetes. It was once called juvenile diabetes. This is a misnomer because it can be diagnosed at any age, although it does get diagnosed more commonly first in children, teens, and young adults.
This accounts for about five to 10% of all diabetes cases worldwide, and a recent analysis article showed that it accounts for about 5.2% in the US. According to the American Diabetes Association, this is caused by an "absolute deficiency of insulin secretion." In other words, the pancreas does not secrete insulin at all. When there is no circulating insulin, the patient must be provided with insulin in some other way as our cells cannot function normally without it. The pathogenesis of Type 1 diabetes results from autoimmune destruction of the insulin-producing beta cells and the islets of Langerhans in the pancreas. The destruction of these beta cells leads directly to a loss of insulin production.
As there is no insulin released into the bloodstream and no insulin available to the cells, Type 1 is often described as an autoimmune disease rather than just a metabolic disorder.
Diabetic Ketoacidosis
- Signs and symptoms:
- Flushed, dry skin
- Dyspnea or air hunger
- Tachycardia
- Orthostatic hypotension
- Drowsiness
- Headache
- Increased thirst, increased urination
- Abdominal pain, nausea, vomiting
- Acetone odor of the breath
It is interesting that about one-third of patients with Type 1 diabetes are diagnosed when they present with diabetic ketoacidosis. There are many signs and symptoms of that, as you can see in this list. One that we hear about often is the acetone-type odor of the breath. The person's breath may smell like nail polish remover.
Type 2 DM
- AKA insulin-resistant diabetes
- Characterized by “a combination of resistance to insulin action and an inadequate compensatory insulin secretory response,” per ADA.
- 90-̶ 95% of all diabetes diagnoses
- Strong link to family history
- 60 ̶ 80% are overweight/obese
- Pathogenesis:
- Primary defects in beta-cell function resulting in variable insulin deficiency
- Inappropriate hepatic glucose production and decreased muscle glucose uptake result in insulin resistance despite the secretion of insulin
- Impaired insulin secretion and insulin resistance
Type two diabetes is also known as insulin-resistant diabetes. The American Diabetes Association states that it is characterized by a combination of resistance to insulin action and an inadequate compensatory insulin secretory response. In effect, insulin is present in the bloodstream, but it is not meeting the individual's metabolic needs. Type two diabetes accounts for about 90 to 95% of all diabetes diagnoses, and these patients do not usually tend to develop ketosis. There is a strong link to family history. In fact, one source that I read stated that over 90% have a close relative who also has Type 2. It may also be related to the environment, and more studies are being done on that.
And, about 60 to 80% of individuals with Type 2 are overweight or obese. You can see that this is where the obesity factor that I mentioned earlier comes into play. For the pathogenesis, essentially, there are primary defects in beta cell function that result in variable insulin deficiency. The inappropriate hepatic glucose production combined with decreased muscle glucose uptake results in insulin resistance despite the secretion of insulin. They have insulin in the bloodstream, but it is not being used as it should be in the cells. In other words, there is both impaired insulin secretion and insulin resistance.
Insulin Resistance
- Body produces insulin but does not use it effectively. Glucose builds up in the blood instead of being absorbed by the cells.
- Driving forces behind insulin resistance:
- Genetics, ethnicity
- Older age
- Physical inactivity
- Excess weight
- Some medications – thiazide diuretics, beta-blockers, corticosteroids, contraceptives, anti-depressants, anti-psychotics, possibly statins
- Sleep apnea
- Smoking
What is insulin resistance? This means that the body produces insulin, but it does not use it effectively. The glucose then builds up in the bloodstream instead of being absorbed by the cells as it should be. There are a number of factors involved in insulin resistance. Genetics or ethnic background may play a role. Other factors may be older age, physical inactivity, and excess weight. Some medications, such as the ones listed there on your slide, may be a culprit. All of these factors are considered driving forces and possible causes of individuals developing insulin resistance.
Prediabetes
- Controversy in the literature of the overuse of the term and whether it’s a clinical diagnosis
- AKA impaired glucose tolerance (IGT) or impaired fasting glucose (IFG)
- Characterized by “blood sugar levels that are higher than normal but not yet high enough to be diagnosed as diabetes,” per ADA.
- High risk of developing Type 2 DM, increased risk of cardiovascular disease
- Common in overweight/obese individuals
- Chronic complications can start in this phase
- Pathogenesis:
- Same as for Type 2 DM—primarily related to insulin resistance
Prediabetes is also known as impaired glucose tolerance or impaired fasting glucose. Most literature states that this is not a clinical diagnosis. There is still some controversy about the overuse of this term. However, it is widely used by some physicians and by many patients.
Individuals may display signs that are related to diabetes, such as obesity, hypertension, dyslipidemia with high triglycerides, and/or low HDL cholesterol. Normally, their three-month A1C test is elevated above normal but not high enough yet to classify as diabetes mellitus. These individuals are at high risk of developing Type 2 diabetes and also of developing cardiovascular pathology. It is also very common in those who are overweight or obese.
Chronic complications may also start in this phase. They do not always begin only when diabetes has been diagnosed. This is generally treated with diet and exercise. The medication metformin is also often used to slow or prevent progression from pre-diabetes to full-blown diabetes Type 2.
The pathogenesis for prediabetes is essentially the same as for Type 2 and is related primarily to insulin resistance.
Other Types
- Latent Autoimmune Diabetes of Adults (LADA)
- AKA Type 1.5 (controversial label)
- WHO classification—“Slowly evolving, immune-mediated diabetes of adults”
- Defined by ADA as a Type 1 DM that evolves more slowly
- Disagreement in literature over definition and categorization
- Gestational Diabetes
- WHO Classification—“Hyperglycemia first detected during pregnancy”:
- Diabetes mellitus in pregnancy—Type 1 or type 2 DM first diagnosed during pregnancy
- Gestational diabetes mellitus—Hyperglycemia below diagnostic thresholds for diabetes in pregnancy
- WHO Classification—“Hyperglycemia first detected during pregnancy”:
There are other types of diabetes, including Latent Autoimmune Diabetes of Adults or LADA, also known as type 1.5 because it shares some similarities with both Type 1 and Type 2. This is considered a kind of controversial label, and not all researchers and physicians like that term type 1.5. As we mentioned earlier, the World Health Organization now calls it "Slowly evolving, immune-mediated diabetes of adults," kind of a mouthful, but it is very descriptive. The American Diabetes Association lists LADA as a Type 1 diabetes that evolves more slowly than the classic disease. They do not recognize it as a specific separate type of diabetes. As there are different criteria to define this and there is not yet agreement in the literature, I will not present them here. You may want to do a little more research by looking at the references when you are finished with the course.
The other type that is sometimes listed is gestational diabetes. In the past, any hyperglycemia that occurred during pregnancy used to be lumped into the category of gestational diabetes. However, now there is more emphasis on diagnosing diabetes during pregnancy when those criteria are met. WHO came up with the classifications of diabetes mellitus in pregnancy versus gestational diabetes mellitus. As we discussed earlier, the ADA still uses the term gestational diabetes in the broader sense, so you will probably hear different classifications.
Signs and Symptoms
- The three Ps:
- Polyuria—increased urination
- Polydipsia—increased thirst (often with dry mouth)
- Polyphagia—increased hunger due to weight loss
- Other signs/symptoms:
- Fatigue
- Blurred vision
- Impaired growth in children
- Susceptibility to infection
Many patients with diabetes have absolutely no signs or symptoms. Signs and symptoms are more common in individuals with Type 1 diabetes because they occur primarily due to high levels of hyperglycemia. Remember, sugar is a diuretic. Elevated blood glucose levels can lead to the famous three Ps. Number one is polyuria or increased urination. Number two is polydypsia or increased thirst often with a dry mouth, and number three is polyphagia or increased hunger due to weight loss. In many cases, it may be just weight loss without the accompanying increased hunger.
Other signs and symptoms include fatigue, blurred vision, impaired growth, and increased susceptibility to infection. As I mentioned, these are more common in Type 1. In Type 2 patients, there are often no symptoms unless their hyperglycemia is severe, especially for an extended period of time.
Life-threatening Diabetic Conditions
- In Type 1 DM—Hyperglycemia with ketoacidosis (<1% mortality rate)
- In Type 2 DM—Hyperosmolar hyperglycemic state (HHS)
- AKA nonketotic hyperosmolar syndrome (NKHS)
- Altered consciousness: Confusion/disorientation to coma
- Seizures
- Medical emergency—mortality rate up to 20%
- HHS precipitating factors:
- Acute infections and other medical conditions
- Nonadherence to diabetes treatment
- Drugs that impair glucose tolerance (glucocorticoids) or increase fluid loss (diuretics)
In some cases, uncontrolled diabetes can also be acutely life-threatening due to the dangers of extreme highs in blood sugar. Extreme high blood sugar presents in two ways. In patients with Type 1 diabetes, it is hyperglycemia with ketoacidosis, which we described earlier, and in severe cases, that can be a medical emergency. However, it is fatal in less than 1% of cases.
Secondly, in patients with Type 2 diabetes, it is more common to see a hyperosmolar hyperglycemic state (HHS). You may also see this called nonketotic hyperosmolar syndrome. The primary symptom is altered consciousness. This can vary anywhere from mild confusion or disorientation to an outright coma. It can also cause seizures. HHS or NKHS can be a very serious medical emergency with a mortality rate of up to 20%.
According to the Merck manual, precipitating factors for HHS include acute infections and other medical conditions, non-adherence to diabetes treatment, drugs that impair glucose tolerance such as glucocorticoids, or an increased fluid loss with diuretics.
Hypoglycemia
- Signs/symptoms of low blood sugar:
- Pale, blanched skin; dry mouth
- Increased sweating
- Dizziness, shakiness, weakness
- Increased respiratory rate
- Irregular or rapid heartbeat
- Anxiety, irritability, confusion
- Headache
- Nausea, vomiting
- In severe cases—delirium, seizures
On the opposite hand, we also want to be aware of when blood sugar may dip too low in our patients. This can be a particular concern when we are prescribing exercise. And of course, it can occur with inadequate food intake or recent insulin injections. We all know what it is like to feel "hangry." We can get irritable, grumpy, and a little shaky. We feel this way until we get some food into us. Hypoglycemia that is associated with diabetes can certainly start with that type of feeling, but it also goes beyond that. It can include typical symptoms of pale or blanched skin and a dry mouth. The patient may have increased sweating, dizziness, shakiness, or weakness. There could also be an increased respiratory rate or irregular or rapid heartbeat. There can be anxiety, irritability, or even some confusion which could include slurred speech. Other symptoms include headache, nausea, and vomiting. In very severe cases, there could be delirium or even seizures. Sometimes, someone with an episode of hypoglycemia can get pulled over by an officer thinking that the person is drunk. Their judgment may be impaired, and they may exhibit all of these symptoms.
Diagnosis-Diabetes
- American Diabetes Assoc. Diabetes Diagnostic Criteria:
- Fasting plasma glucose (FPG): ≥126 mg/dL
- Oral glucose tolerance test (OGTT): ≥200 mg/dL at 2-hr mark (AKA glucose tolerance test, 2-hr plasma glucose test)
- Random (casual) blood glucose level taken at any time of day: ≥200 mg/DL
- Hemoglobin A1C test (HbA1c) test: ≥6.5% (average level of blood glucose over 3 months)
- WHO 2019 Diabetes Diagnostic Criteria:
- Fasting plasma glucose ≥7.0 mmol/L [126 mg/dL]
- 2-hour post-load plasma glucose ≥11.1 mmol/L [200 mg/dL] or
- HbA1c ≥48 mmol/mol
- Calculator to convert between mmol/L and mg/dL: https://www.diabetes.co.uk/blood-sugar-converter.html
According to the American Diabetes Association, a diagnosis of diabetes is a fasting plasma glucose of greater than or equal to 126 milligrams per deciliter. It can also be based on an oral glucose tolerance test, also called a two-hour plasma glucose test or a glucose tolerance test. This would be at a level greater than or equal to 200 milligrams per deciliter at the two-hour mark. Now, if you took a random or casual blood glucose level at any time of day and the patient showed greater than or equal to 200 milligrams per deciliter, that would also be considered diabetes diagnosis level. Finally, one that is used most often now by physicians is the hemoglobin A1c test, which is often abbreviated HbA1c. Usually, they say that if that is equal to or greater than 6.5%, then that would indicate diabetes. This is an average level of blood glucose over three months, so it gives a really good indication of where that patient has been over time and not just with the one test that is being done that day.
The diagnosis criteria for WHO in the 2019 update are very similar. This includes a fasting plasma glucose of greater than or equal to seven millimoles per liter. Since they are an international body, they use the millimoles per liter measurements rather than the milligrams per deciliter that we are used to in the United States. Thus, these numbers are going to be somewhat different. They also have similar types of levels for the post-load plasma glucose. For the HbA1c, they use greater than or equal to 48 millimoles per mole rather than using a percentage as we do here in the US. If you are interested in learning how to convert between the millimoles per liter and the milligrams per deciliter so that you can read between the international and the US classifications, you can look at that link at the bottom of the slide.
Diagnosis-Prediabetes
- American Diabetes Association:
- Fasting plasma glucose (FPG): 100–125 mg/dL (5.6–6.9 mmol/L)
- 2-hr plasma glucose : 140–199 mg/dL (7.8–11.0 mmol/L)
- Hemoglobin A1C test (HbA1c) test: 5.7–6.4% (39–46 mmol/mol)
For a prediabetes diagnosis, the thresholds are just below those that are required for a diabetes diagnosis. The most important one is the fasting plasma glucose level between 100 and 125 milligrams per deciliter. The international units are 5.6 to 6.9 millimoles per liter.
Risk Factors
- Type 1
- Family history—parent or sibling
- Age—more common in children, teens, young adults
- Ethnic background—In the U.S., whites have higher rates than African Americans and Hispanic/Latino Americans.
- Type 2
- Predisposing conditions—prediabetes, hypertension, hyperlipidemia (HDL ≤35, triglycerides ≥250), non-alcoholic fatty liver disease
- Overweight/obesity—BMI >25; risk increases with higher BMI
- Age ≥45 years
- Family history—parent or sibling
- Inactivity—physically active less than 3 times a week
- Prior gestational diabetes or a baby weighing >9 pounds
- Ethnicity—African American, Hispanic/Latino American, American Indian, or Alaska Native (some Pacific Islanders and Asian Americans are also at higher risk)
Here is a brief review of risk factors as outlined by the CDC. For Type 1, there is a family history, often a parent or sibling. Age is a risk factor, as we mentioned before. It is more common in younger persons, especially children and teens, although it can occur at any age. Finally, ethnic background is another factor. In the US, whites are more likely to develop Type 1 diabetes than African-Americans, Hispanics, or Latino Americans.
For Type 2, again, according to the CDC, predisposing conditions such as prediabetes, hypertension, hyperlipidemia, and so on are factors. Additionally, risk factors include being overweight or obese, age of 45 or over, a family history with a parent or sibling who has had Type 2 diabetes mellitus, inactivity, which they define as physically active less than three times a week, having had prior gestational diabetes or having given birth to a baby weighing more than nine pounds, and finally ethnicity. African Americans, Hispanics/Latino Americans, American Indians, or Alaska Natives are at a higher risk. Some Pacific Islanders and Asian Americans are also at higher risk. Just a quick side note about ethnic group names, I am using the ethnic group names that are used by the CDC and also on the US census. If you belong to one of those groups and you prefer a different name for your ethnic group, for example, black versus African American, please know that I absolutely respect that. I am just using the information from the CDC.
Essentially, for pre-diabetes, you can pretty much say that the risk factors are the same as for Type 2 diabetes.
Epidemiology
- Reminder:
- Prevalence = how much exists in the population (how widespread the condition is)
- Incidence = how many new cases in a given period (the risk of contracting the condition)
- Diabetes Prevalence (from CDC National Diabetes Statistics Report, 2020—based on 2018 data)
- Total: 34.2 million people had diabetes (10.5% of the US population)
- Adults: 34.1 million adults aged 18 years or older (13.0% of all US adults)
- Diagnosed: 26.9 million people, including 26.8 million adults
- Undiagnosed: 7.3 million people (21.4% are undiagnosed)
- Older adults: 14.3 million (diagnosed and undiagnosed)
- Prediabetes Prevalence (2018)
- Total: 88 million people aged 18 years or older (34.5% of all US adults)
- Older adults: 24.2 million people
- Diabetes Prevalence (from CDC National Diabetes Statistics Report, 2020—based on 2018 data)
I used to always forget the difference between prevalence and incidence. I put the definitions in here in case any of you also occasionally forget which is which. Prevalence is how much of a condition or disease there is in the population at a given time, and the incidence is how many new cases of that condition or disease develop during a particular time period. Another way to think of it is that prevalence indicates how widespread disease is, while incidence tells us about the risk of contracting that disease or condition.
These numbers are all from the CDC National Diabetes Statistics Report of 2020, which they based on 2018 data from the US. In the United States in 2018, there were 34.2 million people who had diabetes, or 10.5% of the population. And, 34.1 million of those were adults aged 18 or over or 13% of all US adults. There were 26.9 million people, including 26.8 million adults diagnosed with diabetes, and 7.3 million were undiagnosed. In other words, 21.4% were undiagnosed. Among older adults, those 65 years or over, there were 14.3 million (both diagnosed and undiagnosed). For prediabetes, in 2018, there were 88 million people aged 18 or over who had prediabetes, or 34.5% of the total US adult population. For those 65 years or older, there were 24.2 million people in that age group who had prediabetes.
- Prevalence and incidence increase significantly with age.
- Incidence is higher in specific U.S. populations:
- Older adults
- Native Americans
- African Americans
- Pacific Islanders
- Latinos (especially Mexican Americans)
- International Diabetes Federation—worldwide, approx. 463 million adults were living with diabetes in 2019, with a projected increase to 693 million by 2045.
The prevalence and incidence of diabetes and prediabetes, as you know, increased quite significantly with age. Incidence is also higher in specific populations that include older adults, Native Americans, African Americans, Pacific Islanders, and Latinos, especially Mexican Americans. In fact, it is almost double for Native Americans and African Americans. This epidemic is obviously not just in the US. The International Diabetes Federation estimated that worldwide approximately 463 million adults were living with diabetes in 2019, with a projected increase to 693 million by 2045 if effective prevention methods were not adopted. The statistics for older adults worldwide are also similar to the statistics in the US. In other words, this is a major problem in geriatric care in nations all around the world.
- US older adults (age 65 years and over), 2018:
- Total number = 52 million
- With diabetes = 14.3 million (27.5% of age group)
- With prediabetes = 24.2 million (46.5% of age group)
- Total with diabetes/prediabetes = 38.5 million (74% of age group!)
- “Graying of America”
- 52 million in 2018, projected to increase to 95 million by 2060
- A projected increase from 16% to 23% of the population
- Diabetes is projected to increase proportionally
Now that I have thrown a lot of numbers let's focus on just one area among these numbers and look more closely at the statistics for older Americans. In 2018, the total number of older adults in the US, that is, people aged 65 or over, was 52 million. Of these, 14.3 million had diabetes, or 27.5% of the age group, and 24.2 million had prediabetes or 46.5% of the age group. This is a total of 38.5 million, or 74% of that age group. In other words, 74% of older adults in the US were affected by diabetes or prediabetes. In 2018, three-quarters of the older adults who walked through your door were probably affected. As healthcare providers, this is definitely something we want to be aware of.
It is also important to remember that the proportion of older adults within the US population is growing steadily, sometimes referred to as the "Graying of America." In 2018, there were 52 million Americans who were aged 65 or older, and that number is projected to nearly double to 95 million by 2060, with this age group increasing from 16% to 23% of the total population. Of course, we expect diabetes to increase proportionally as well.
Long-term Trends: 1958-2018
Many of these older adults are living much longer than their parent's generation did, so they will have longer to live with the disease once they are diagnosed with it. For all of these reasons, we can expect to see many more older patients with diabetes over the coming decades. As providers, we need to be ready for that.
As we've been talking about, diabetes is very widespread. It is increasing at a really pretty alarming rate, as you can see from this graph in Figure 2.
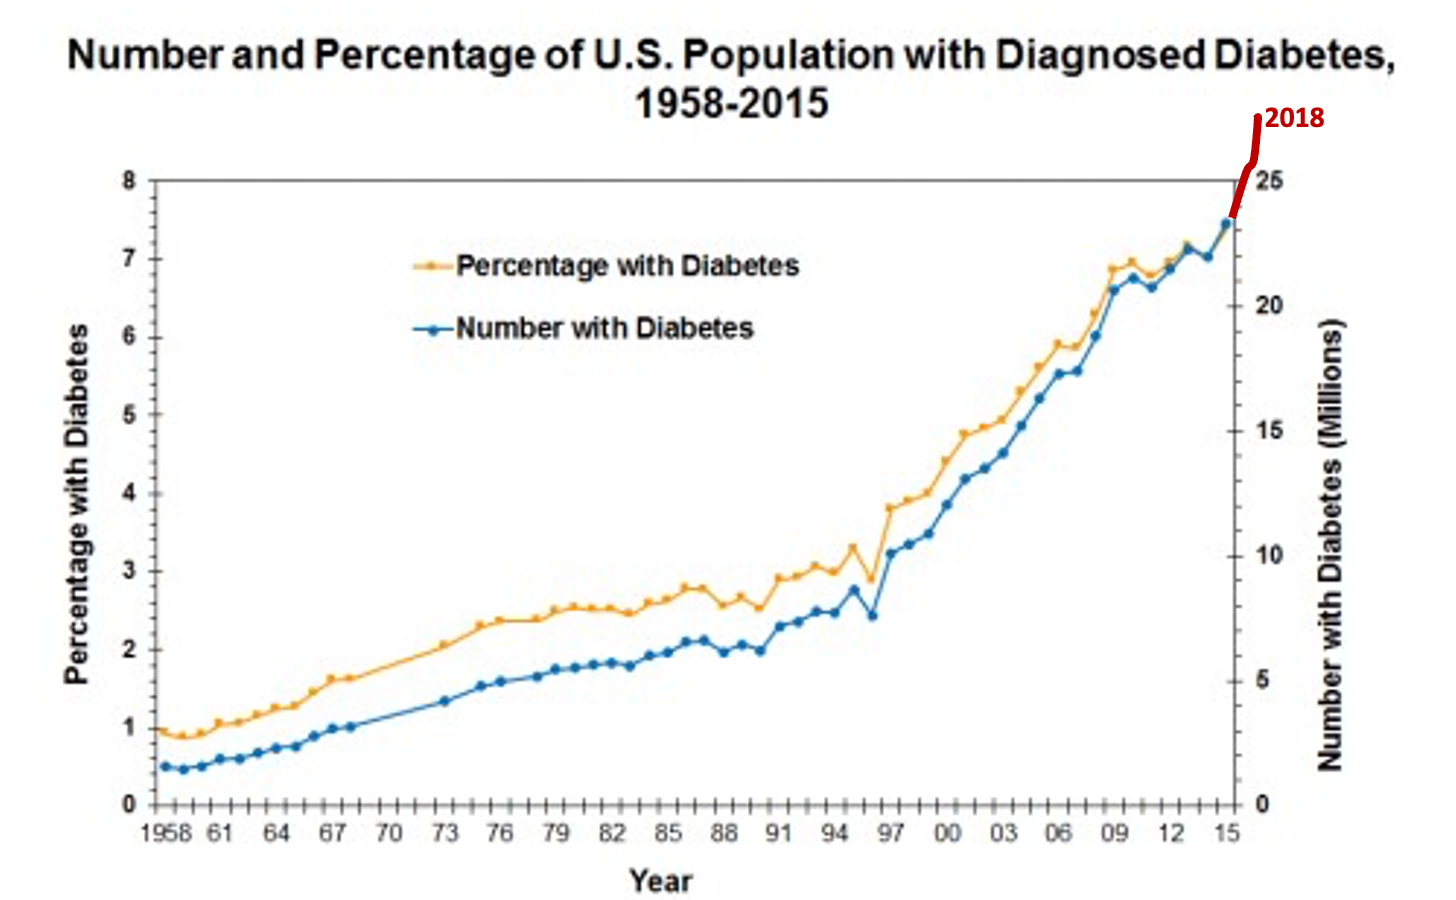
Figure 2. Long-term trends of diabetes from 1958-2015. Source: CDC [Public Domain] via www.cdc.gov/diabetes/data)
If you look at the left side of that, you can see that from 1958 until about the late 1980s, it was sort of a gradual increase, but then all of a sudden, the curve gets very steep over the last three decades. It is especially steep when we add in the 2018 figures, which are shown over here in red on the right-hand side. For another visual, let's take a look at this map which shows the changes from 2004 to 2008 to 2016 in Figure 3.
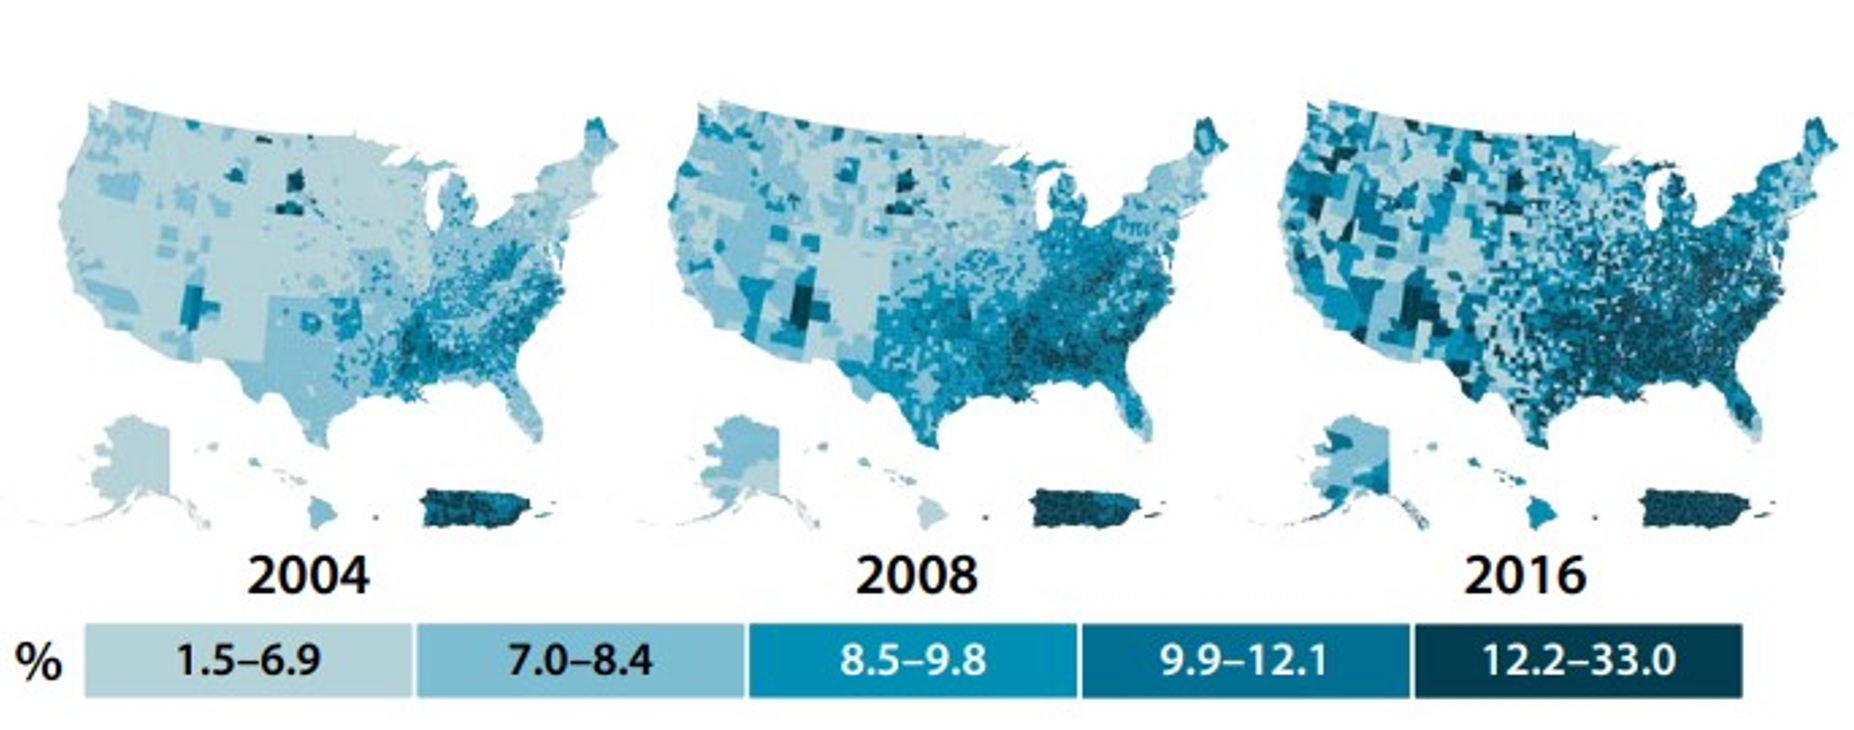
Figure 3. Change in prevalence of diagnosed adult diabetes from 2004, 2008, and 2016 (By U.S. Centers for Disease Control and Prevention [Public domain], via www.cdc.gov/obesity/data/prevalence-maps.html. Data sources: US Diabetes Surveillance System, Behavioral Risk Factor Surveillance System)
If 2020 was included in this graphic, it would be even darker. As you move to the right, each map gets darker, indicating more and more cases showing up of a diagnosed adult diabetes. As a matter of fact, the incidence and prevalence rates in the US are rising much faster than projections made some time ago.
- 2000—11 million cases of diagnosed diabetes in the U.S.
- Projection in 2000: 29 million diagnosed cases by 2050
- The reality in 2018—27 million diagnosed cases in the U.S.
In the year 2000, there were 11 million cases of diagnosed diabetes in the US. In that year, researchers projected that by 2050, there would be a whopping 29 million diagnosed cases in the US. However, in 2018, we already had 27 million diagnosed cases. This is definitely not a trend we want to be on. Unfortunately, the target of 29 million is 30 years ahead of when it was initially projected.
Mortality
- 7th leading cause of death in U.S., 2018
- 84,946 deaths
- Contributing factor in approx. 300,000 more deaths
In 2018, diabetes was the seventh leading cause of death in the US, accounting for 84,946 deaths. We should remember that compared to other things like cancer and heart disease, this is relatively low on the list, but it still is pretty major. It is also important to remember that diabetes is a contributing factor in approximately 300,000 more deaths in 2018. Diabetes is a disease that is not just life-changing, but it can, in some cases, also be life-threatening, especially for older adults.
Overweight and Obesity
- Definition: Weight that is higher than considered healthy for a given height (per CDC). Based on body mass index (BMI) = weight divided by the square of the height (kg/m2)
- Adult Body Mass Index (BMI)
- Underweight: <18.5
- Normal: 18.5 to <25
- Overweight: 25.0 to <30
- Obese: ≥30.0
- Class 1: BMI of 30 to <35
- Class 2: BMI of 35 to <40
- Class 3: BMI of ≥40; “extreme” or “severe” obesity
- Morbid obesity: 100 pounds over ideal body weight, BMI of ≥40, OR BMI of ≥35, and experiencing obesity-related health conditions, such as hypertension or diabetes.
BMI Calculator: https://www.cdc.gov/healthyweight/assessing/bmi/adult_bmi/english_bmi_calculator/bmi_calculator.html
We talked earlier about being overweight or obese as a major risk factor for developing Type 2 diabetes. When you look at lists of common obesity-related conditions, Type 2 diabetes is usually right near the top of the list. Let's look first at definitions. According to the CDC, overweight or obesity is the weight that is higher than what is considered a healthy weight for a given height, and it is usually based on Body Mass Index or BMI. This is the weight in kilograms divided by the square of the height in meters to give you kilograms per meter squared. However, it is interesting that BMI is almost always expressed without the units. Just know in your head that there is an unexpressed kilogram per meter squared at the end of that number. If you want to calculate BMI for yourself or any of your patients, I have included a handy calculator from the CDC. There are several other great ones out there as well that are available.
Here is a quick review of our definitions. Underweight is considered BMI less than 18.5, 18.5 to less than 25 normal, 25 to less than 30 is overweight, and anything of 30 or higher is considered obese. The obese category is usually subdivided into some subcategories, with Class 1 being 30 to less than 35, Class 2 being 35 to less than 40, and Class 3 is a BMI of 40 or over, which is often categorized as extreme or severe obesity. I am sure that you have all heard of the term morbid obesity. According to the CDC, an individual is considered morbidly obese if a person is 100 pounds over the ideal body weight, has a BMI of 40 or more or a 35 or more, and is experiencing obesity-related health conditions such as high blood pressure or diabetes.
- Individuals with obesity are at increased risk for:
- Hypertension, heart disease, and stroke
- Type 2 diabetes
- Some types of cancer
- Gallbladder disease
- Osteoarthritis
- Sleep apnea and breathing problems
- Mental health issues and reduced quality of life
- Complications with COVID-19
- All-cause mortality
We know that being overweight and obese can cause lots of problems. Individuals with obesity are at an increased risk for all of those things that you see listed above. You can see that Type 2 diabetes is right at the top of the list. Other increased risks include mental health issues and reduced quality of life. We do not often talk about this, but it is important in the therapy realm. Recently, we learned that any individual with obesity who contracts COVID-19 is much more likely to have complications and have higher rates of death. Severe disease and obesity are also an increased risk of all-cause mortality.
- Trends:
- 1990: 15% of U.S. adults were obese
- 2020: >35% are obese; 30-35% are overweight (i.e., 2/3 of U.S. adults have a BMI of ≥25)
- Individuals of normal weight are now in the minority!
Here is one final set of comparative statistics. In 1990, about 15% of US adults were considered obese, and from 2020 to 2021, that rate increased to over 35%. Another 30 to 35% of individuals are considered overweight, although they are not yet obese. In other words, now more than two-thirds of US adults have a BMI of 25 or greater. Those who are of normal weight are now at a minority in our country, and there are significantly more people of unhealthy weight than of normal weight in the US.
- Regional differences due to:
- Genetic factors
- Cultural influences
- Regional dietary habits
- Racial and ethnic backgrounds
- Poverty levels
- Education levels
- Fitness participation
- Other factors
Obesity rates vary from state to state. On those earlier maps, you saw that certain regions experience higher overall rates. The reason for this is multifaceted and appears to be due to a very complex combination of factors, some of which are listed above, such as genetic factors, cultural influences, dietary habits, racial and ethnic backgrounds, poverty, education levels, fitness participation, and many other factors. Why we have increased obesity in some areas is a very complicated equation, and there is no one easy solution. As therapy professionals, we have to be aware of this and do what we can to change this trajectory. Figure 4 shows a visual of the prevalence of self-reported adult obesity.

Figure 4. Prevalence of Self-Reported Adult Obesity by State and Territory, 2012 and 2019 (By U.S. Centers for Disease Control and Prevention [Public domain], via www.cdc.gov/obesity/data/prevalence-maps.html. Data source: Behavioral Risk Factor Surveillance System).
The map on the left is from 2012, and the one on the right is from 2019. You can see more of that red and orange color indicating more obesity reported in 2019. It is a pretty dramatic change after just seven years. This helps demonstrate why obesity is considered a public health crisis in the US and helps explain why diabetes is increasing so dramatically in recent decades. Comparing the earlier maps to these, you can see that obesity and diabetes rates are highly concentrated in the central part of the US, particularly in parts of the South and Midwest. So, it should be no surprise to any of us that high rates of obesity and high rates of diabetes go hand in hand.
Complications
- Acute vs. chronic
- More common in geriatric patients
- American Diabetes Association: “The chronic hyperglycemia of diabetes is associated with long-term damage, dysfunction, and failure of various organs, especially the eyes, kidneys, nerves, heart, and blood vessels.”
- Macrovascular due to stiffening of blood vessel walls, weakening of the collagen in blood vessels, and alterations of lipid deposits that make them more atherogenic (plaque-forming)
- Microvascular due to chronic hyperglycemia; accumulation of glycated hemoglobin (HbA1c) at the basement membrane of long-lived cells (e.g., brain cells, nerves, the lens of eye, cornea) → , kidney failure, retinal changes, nerve damage/dysfunction, etc.
- We all know that the reason diabetes is so problematic is chiefly because of the complications that it causes with many different body systems.
There are acute complications that we mentioned previously that could happen when the blood sugar gets extremely high. There are also chronic complications. This is what we will focus on in this section. These can affect many different body systems, as that American Diabetes Association quote there indicates. While not immediately life-threatening, chronic complications of diabetes are certainly life-altering, and some may also become life-threatening over time. All of these complications are more common in older adults who may already have age-related changes or diseases present in some of these body systems. Overall, diabetes complications lead to high levels of morbidity and mortality that affect not only individuals but also families, healthcare systems, and even society as a whole.
Let's quickly review what the pathogenesis of these chronic complications is and what causes them. One way to look at these is to divide the complications into whether they are macrovascular or microvascular. The macrovascular changes occur in large and medium-sized blood vessels. These can lead to coronary ischemia, stroke, peripheral artery insufficiency, and these types of problems. Macrovascular complications most likely occur due to the role that diabetes plays in stiffening of blood vessel walls, weakening of the collagen and blood vessels, and alterations of lipid deposits that make them more atherogenic (causing more formation of plaques in the arteries). Microvascular complications of diabetes are basically due to chronic hyperglycemia. As Rodner explains it, it primarily has to do with the accumulation of glycated hemoglobin, which we know as HbA1c. You probably remember from school that hemoglobin is a protein and that glycation means bonding of a protein or lipid molecule with a sugar molecule such as fructose or glucose. Glycated hemoglobin or HbA1c is thus hemoglobin with a sugar attached to the end of the molecule. Remember from our earlier discussion that normally 6% or less of circulating hemoglobin is HbA1c, but in individuals with diabetes, those HbA1c levels can be significantly higher. The reason this is a problem (Rodner) is that glycoproteins tend to accumulate at the basement membrane in long-lived cells like brain cells, nerves, the lens of the eye, cornea, and so forth. When there is this excess accumulation due to too many glycated hemoglobin proteins in the blood, this is what leads to the long-term microvascular-related disease states of diabetes, such as kidney failure, nerve damage or dysfunction, retinal changes, and so forth.
- List of Complications (APTA)
- Heart disease
- Heart attack
- Stroke
- High blood pressure
- Retinopathy (eye disease) can lead to vision problems and blindness
- Kidney disease
- Neuropathy (nervous system disease). This can result in foot and hand pain, inner-ear nerve damage, and balance problems
- Peripheral vascular disease (a blood circulation disorder)
- Reduced muscle strength (frailty) and physical function
- Skin problems, including sores, ulcers, and infections
- Cell death (necrosis), most often in toes and feet
- Amputations
- Premature death
The APTA has a wonderful website for consumers called ChoosePT. On the site, they have a list of possible complications for all types of diabetes. Frankly, it makes me want to be sure not to skip my run tomorrow. As I mentioned before, older adults are at higher risk of developing these complications, so we always need to be on the lookout for them, especially in that age group.
Cardiovascular and Cerebrovascular Pathology
- Diabetic cardiomyopathy
- Hypertension
- Increased risk of atherosclerotic plaques
- Cardiovascular changes → heart failure / myocardial infarction / sudden cardiac death
- Heart disease = leading cause of death in the U.S.
- Cerebrovascular changes → stroke, usually ischemic
- Stroke = 5th leading cause of death in the U.S., 2018
First, let's look at cardiovascular and cerebrovascular pathology. The basic things we are looking at are diabetic cardiomyopathy, hypertension, and an increased risk of atherosclerotic plaques. Cardiovascular changes can lead to heart failure, myocardial infarction, or even sudden cardiac death. As we all know, heart disease has long been the leading cause of death in the US.
Cerebrovascular changes can lead to a stroke which is usually ischemic. Stroke is currently the fifth leading cause of death in the US, or it was in 2018 in those numbers that were reported. For a quick visual related to stroke, let's take a look at another map in Figure 5.
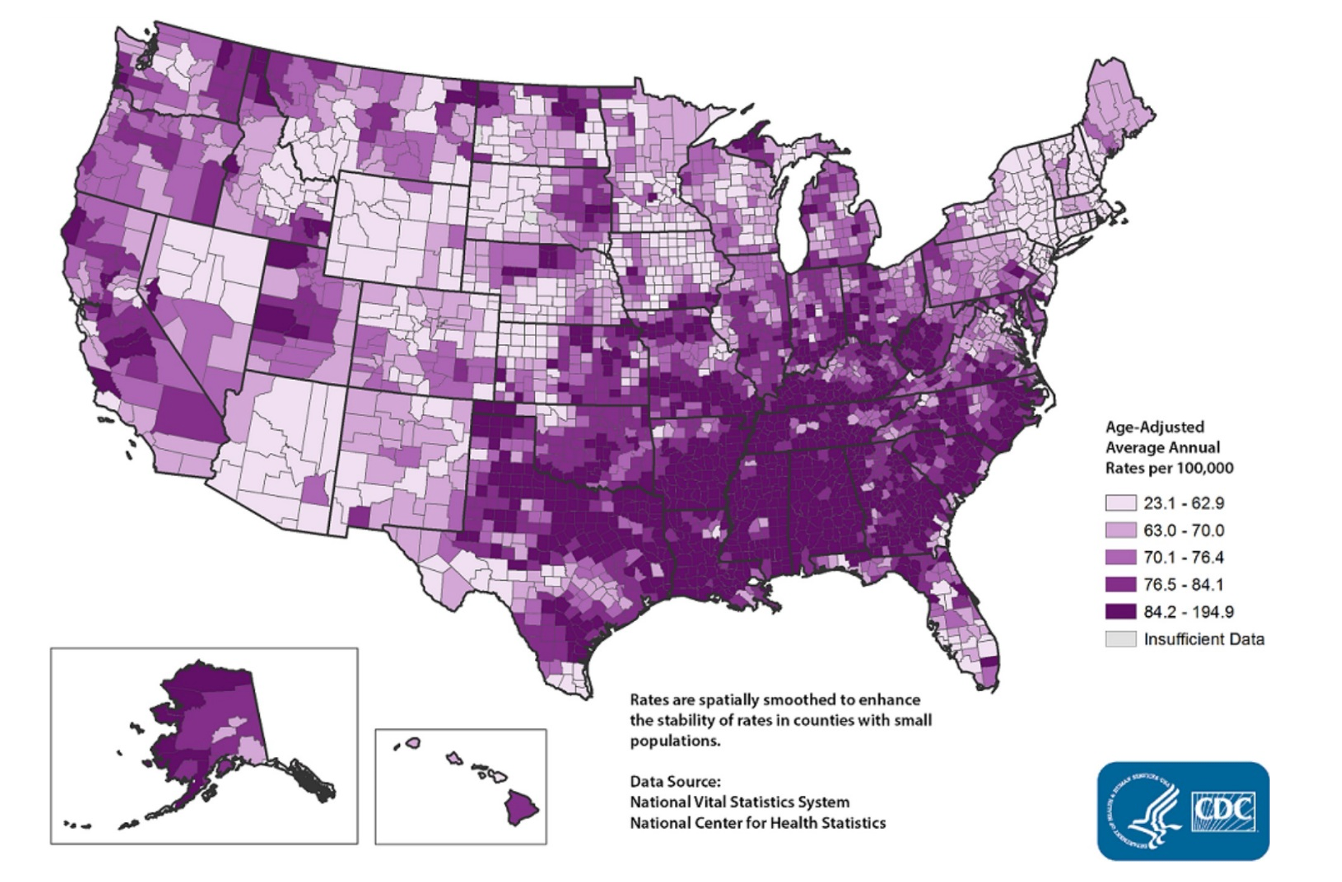
Figure 5. Stroke death rates by county among adults age 35+, 2014-2016. (By CDC, Interactive Atlas of Heart Disease and Stroke [Public domain], via https://www.cdc.gov/dhdsp/maps/atlas/index.htm).
This is a map of stroke deaths in the US from a few years back. You can see greater numbers for the incidence of strokes in the South and the Midwest. In fact, this is sometimes referred to as the stroke belt. This does not mean all of these strokes were from diabetes, but you can see this map looks a lot like the maps that we saw earlier. It is not a coincidence that stroke occurrence and deaths are higher in areas with there are high diabetes and obesity rates, as we discussed earlier. Again, there are all these overlapping and interlocking factors that come into play.
Nephropathy
- AKA diabetic kidney disease
- Occurs in 20–40% of patients with diabetes
- Nephropathy → dialysis → (kidney transplant) → end-stage renal disease → death
- Kidney disease = 9th leading cause of death in the U.S., 2018
Another common chronic complication is nephropathy or diabetic kidney disease, which occurs in about 20 to 40% of patients with diabetes. It is the leading cause of end-stage renal disease. Nephropathy can cause the patient to need dialysis or even a kidney transplant. And as things worsen, they may develop end-stage renal disease, which could ultimately lead to death. In 2018, kidney disease was the ninth leading cause of death in the US.
Retinopathy
- Found in up to 20% of patients when diagnosed with diabetes
- Annual eye exam needed
- Patients with diabetes also have higher rates of glaucoma, cataracts
- Retinopathy → vision loss → blindness
Another common and serious complication is retinopathy. This is found in up to 20% of patients when their diabetes is first diagnosed. We need to remind our clients with diabetes to get an annual eye exam. In addition to the trouble with retinopathy, they also have increased rates of glaucoma and cataracts. With retinopathy, there is a gradual worsening of vision, and in some patients, this can even lead to blindness.
Neuropathy
- Occurs in about 50% of patients with diabetes
- Microvascular changes cause decreased blood supply to nerves’ myelin sheaths
- Four types:
- 1.Mononeuropathy, AKA focal neuropathy—affects specific cranial/peripheral nerve (e.g., carpal tunnel syndrome, Bell’s palsy)
- 2.Proximal neuropathy, AKA diabetic polyradiculopathy or amyotrophy—affects nerves in the lower extremities, buttocks, or trunk, usually on one side of the body
- 3.Autonomic neuropathy—often underappreciated in patients
- Gastroparesis (delayed gastric emptying)
- Orthostatic hypotension
- Urinary retention or bowel problems
- Sexual dysfunction
- Slowed pupillary light reflex
- Hypoglycemia unawareness
- 4.Peripheral neuropathy—pain, paresthesias, reduced sensitivity to touch
One of the most familiar to us is neuropathy. This is a complication that occurs in roughly 50% of patients with diabetes. Microvascular changes cause decreased blood supply to the nerves' myelin sheaths. Due to this, the client begins to have various nerve symptoms occur.
There are four main types of neuropathy that are described by the CDC. The first of these is mononeuropathy or focal neuropathy. This affects a specific cranial nerve (like in Bell's palsy) or specific peripheral nerves such as the median nerve in carpal tunnel syndrome. The second type is proximal neuropathy, also called diabetic polyradiculopathy or amyotrophy. This typically affects nerves in the lower extremity, buttocks, or trunk. And it is usually on one side of the body. The third type is autonomic neuropathy. This one is often underappreciated and missed in clients. Common symptoms are delayed gastric emptying, orthostatic hypotension, urinary retention, bowel problems, sexual dysfunction, a slowed pupillary light reflex, and then a very important one, hypoglycemia unawareness. This is where the patient is unable to tell when their blood sugar levels are getting low.
Peripheral neuropathy generally causes a burning type of pain, although sometimes it can be a cramping or stabbing type of pain. Often, there are paresthesias or a reduced sensitivity to touch. Many clients can all three of these symptoms at once.
As therapists, we are well aware of how negatively diabetic neuropathy can affect the patient's feet. It is usually bilateral and symmetrical in a stocking-glove pattern. It affects first the feet and legs, and later on, it can also affect the hands. These symptoms may worsen at night.
Other Complications
- Peripheral vascular disease—Pain and fatigue in the legs, especially during exercise
- Skin complications— skin breakdown, poor wound healing, infections, necrosis
- Musculoskeletal complications
- Osteoarthritis (and slightly higher risk of rheumatoid arthritis)
- Frozen shoulder
- Dupuytren’s contracture
- Diabetic hand syndrome
- Diffuse idiopathic skeletal hyperostosis (DISH)
- Charcot joint, particularly of the feet and ankles
- Bursitis, particularly of the shoulder and hips
- Increased risk of falls and fractures
- Increased risk of frailty
Other complications that can occur with chronic diabetes include peripheral vascular disease, which can be due to both macro and microvascular dysfunction. It presents as pain and fatigue in the legs, especially during exercise. There can also be skin complications like skin breakdown, poor wound healing, and infections. It can also lead to the involvement of deeper tissue and eventual necrosis, especially of the toes and feet. Those last three complications (peripheral neuropathy, peripheral vascular disease, and skin complications) often go hand in hand. You can imagine that if you have a patient who has all three of those, that is going to be very bad news. In fact, the risk of gangrene of the foot is 10 to 30 times higher among individuals with diabetes than it is in age-matched controls without diabetes.
It is really important that we educate our patients with diabetes about how important foot care is. Patients must check their feet regularly, but unfortunately, this is a problem for any who also has vision problems. So some doctors recommend regular visits to a podiatrist to help overcome that. And we know that the correct footwear is also very important with these patients, and therapy staff may sometimes be involved in assisting with or recommending correct footwear. And then finally, musculoskeletal complications, which are of particular importance to PTs and OTs, especially when we are dealing with older patients. These include an increased risk of osteoarthritis and also a slightly increased risk of rheumatoid arthritis, frozen shoulder, Dupuytren's contracture, diabetic hand syndrome, DISH, which you'll remember as hardening of tendons and ligaments of the spine, charcoal joints, especially in the feet and ankles, bursitis, especially of the shoulder and hips.
Then the two most important for us to remember as providers are increased risk of falls and fractures and also an increased risk of frailty. Those are things that we can address in our physical therapy practices.
Common Comorbidities
- Often present in patients with DM, especially older adults:
- Hearing impairment
- Obstructive sleep apnea
- Fatty liver disease
- Low testosterone
- Periodontal disease
- Cancer, especially of the liver, pancreas, endometrium, colon/rectum, breast
- Osteoporosis, hip fracture, and vertebral fracture
- Cognitive impairment
- Depression—Older adults with DM: 30% have depressive symptoms, 12-18% have major depression
- Geriatric Depression Scale: https://geriatrictoolkit.missouri.edu/cog/GDS_SHORT_FORM.PDF
- COVID-19—Increased rates of severity, complications, and mortality
In addition to all of the complications, there are also quite a few comorbidities that may be present in patients with diabetes, especially if they are 65 or older. Some of these range from hearing impairment, periodontal disease, cancer, cognitive impairment, and depression.
As a side note about depression, Park and Reynolds reported that up to 30% of older adults with diabetes mellitus have a significant number of depressive symptoms, and 12 to 18% actually meet the diagnostic criteria for major depression. Depression is already significantly under-recognized and underdiagnosed in older adults. I would strongly recommend that you become familiar with how to screen for depression with your patients, such as using the Geriatric Depression Scale. If you do not already use it, you might want to become familiar with that and also know how to refer those patients for further care. This is a really important part of our practice to keep an eye on. You could actually save a life if you screen for depression. There is a link for the Geriatric Depression Scale that you may find helpful.
Finally, it has been found that individuals with diabetes, who contract COVID-19, may have increased rates of severity, complications, and an increased risk of mortality.
Medical Treatment
- Type 1—Insulin: injections, pumps, external artificial pancreas; continuous glucose monitoring systems
- Type 2—Oral meds and lifestyle changes, insulin (less commonly)
- CDC Diabetes Care Goals:
- 1.Hemoglobin A1C level <8%
- 2.Blood pressure <140/90 mmHg
- 3.Cholesterol level: non-HDL <130 mg/dL
- 4.Currently not smokers
- Manage your ABCs:
- A: Get a regular A1C test to measure your average blood sugar over 2 to 3 months; aim to stay in your target range as much as possible.
- B: Try to keep your blood pressure below 140/90 mm Hg (or the target your doctor sets).
- C: Control your cholesterol levels.
- s: Stop smoking or don’t start.
Individuals with Type 1 do not have insulin. Thus, we need to provide that. This can be via injections, pumps, external artificial pancreas systems, or many patients now use continuous glucose monitoring systems. For Type 2, typically, the medical treatment is oral medications and lifestyle changes. In some cases, insulin may also be used. I will not delve into all the various medications that are available, but it is important to know those. If you want to provide your patients with some good information, there is a nice summary at that link that is shown above.
The CDC focuses on four main diabetes care goals for medical treatment. This includes a public education campaign called the "Manage Your ABCs." A is getting a regular A1C test. You want the level to be less than 8%. The B is controlling blood pressure at less than 140 over 90 millimeters of mercury. C is keeping the cholesterol level under control with a non-HDL of fewer than 130 milligrams per deciliter. The "s" of the ABCs is not to be a smoker. If you are a smoker, stop. And if you are not, do not start. The CDC also has some great information for patient education on its website.
Therapy Intervention
- Encourage lifestyle modifications and self-care:
- Exercise; decrease sitting time
- Weight loss/weight management
- Healthy eating
- Smoking cessation
- Foot care
- Monitoring blood sugar levels
- Medication adherence
- Safety (home, workplace, community)
- Dental care&a